


The level of development of a country implies how socially, economically and culturally and technologically advanced is that country. The model of classification of countries is not the same all over the world.
The Brandt Line
It is an imaginative line that classified the planet into the poor south and rich north. However, the world has seen a dynamic change in the last 20 years and this line is not of much significance and is too simplistic and vague.
Classification by World Bank
The classification of a country’s level of development is done in the following way:
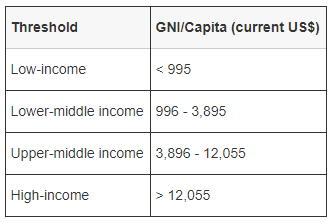
- Low-income Countries (LIC) – the GNI per capita income of these countries is less than $995 or even less.
- Lower middle-Income Countries (LIC) – the GNI per capita income for these countries ranges from $995 to $3895. Examples – Ethiopia and Chad.
- Upper Medium-Income Countries (MIC) – the GNI per capita income of these countries ranges between $3896 to $12,055. Example – Iraq and Mexico
MEASURES OF DEVELOPMENT
How do countries develop? There need to be some set indicators that signify the development such as the economy and social measures.
Human Development Index
This index is used to measure human development. It is provided by united nations. It measures the average life expectancy of the country’s people, the income of the country and the level of education in a particular country. A score between 0 to 1 is considered in which the country with a score closer to 1 is considered more developed.
Some other measures of development
Although HDI is the most widely accepted and best measure to ascertain the economic and social factors, there are some other factors too which can be used for measuring development.
- Access to safe water – It is the percentage of people with access to clean and safe drinking water.
- Birth rate- It implies the number of live births per thousand people in a country during a particular period. Less developed countries have high birth rates which lead to a large population.
- Death rate – It implies the number of deaths per thousand people in a country during a particular period. High death rates in country is an indicator or less development.
- GNI per capita – It is Gross National Income per person. It is calculated as the value of a country’s income divided by the number of people in a country.
- Infant mortality rate – The number of infants who die before the age of one per 1000 live births. It was 3.8 deaths per 1000 births in the UK in 2018.
- Life expectancy – The average age of people living in the country.
- Literacy rate – Total per cent of the population who can write and read. Adult literacy rate of the UK between 2008 to 2018 remained stable at 99%.
- People per doctor – The number of doctor for every thousand people. The UK has 2.8 doctors for every thousand people.
The Demographic Transition Model and Development
This model displays the population change over a period. There are five stages in this model and these are connected to the levels of the development.
Limitations of different measures of development
Relying on only one measure of development can produce vagueness, which is why it is usually better to use more than one measure. For example – Zimbabwe is considered a low-income country but its 84 per cent of the population is literate.
Another good example is China. It has a very low birth rate, still, it is not listed in the high-income countries by world bank. China’s policy of one child per family has significantly reduced their birth rates.
However, this policy has been changed now and couples are allowed to have two children. Demography experts have been showing concerns for many years over the strict birth control methods of China. They have been pointing out that these kinds of control can lead to the demographic crisis which can create gender imbalance and bring the population to a stage where most of the population is growing old. The low fertility rates and longer life expectancy of China’s population, the UN estimates that 37% of their population will be over the age of 60 by 2050 putting them in the category of the ageing population. There is steep declie in the working age population of the country.
Advantages and Disadvantages of measures of development:
- Birth rate – It is a good indicator that signifies social advancement and shows that most of the developed countries have low birth rates. Nevertheless, birth rates can be changed by the policies of the government. Now, it is not necessary that policy is implemented well and thus good policies do not always result in the development of the country.
- Death rate – It signifies the effectiveness of the healthcare system in a country. It also implies the good living standard of people living in a country. However, rich countries usually have older generation and that can signify higher birth rates.
- GNI per capita – This is a significant measure in showing the economic development of a country but it does not give any information about the living standard of the people living in a country. It takes an average number into consideration and thus fails to bring out the information on the extremities or gap between rich and poor in the population.
- HDI – It is accepted almost all over the world and is a good method to measure development. It takes economic and social parameters into consideration which can help to identify the development of a country in true sense.
Factors affecting global development
There are several factors that determine the level of development.
- Physical factors – some regions with difficult terrain and hostile conditions can affect the pace of development in a country. For example – the very cold climates or tundra climates makes it impossible for the population to grow any kind of crop and further freezing and melting of the snow makes it difficult to establish stable infrastructure in the area.
- Economic factors – Countries with high debts have to spend a lot of its earnings on interests and repayments of loan and often put a lot of tax pressure on the population living in the country. Also, the money which could have been spent on the development of the country is now lost in payment of these loans.
- Environmental factors – Some countries experience environmental problems which prevent their development. Example – Indonesia is constantly hit cyclones which lead to destruction of infrastructure on a huge scale every year.
- Social factors – Some issues are created by people. It involves poor water and sanitation, inadequate education facilities and poor quality of health services.
- Political factors – Countries that are constantly at war or have corrupt government faces a developmental crisis. The money does not reach people of the country and the spending on important areas such as education and infrastructure may be insufficient.
- Natural resources – The abundance of raw materials such as minerals, oil and metals. These minerals are used to increase the trade balance.
Poverty
The factors that influence development are generally connected and countries call fall in the cycle of poverty. For example – A country already burdened under the dept cannot put money in providing good infrastructure, educational and health facilities. Thus, people cannot afford hood hospitals and also have less awareness about the need for good sanitation and water. This leads to poor health of population creating a lot of diseases which further put pressure on the economy of the country. A less healthy population cannot contribute to the wellness of the economy and the cycle of poverty continues.
Consequences of inequalities in development
Uneven growth can create huge economic differences in a country. Also, countries with higher income can use their money to influence the decisions of other low-income countries.
Low-income countries
The lack of efficient health services, safe and clean water and poor housing problems are common in lower income countries. The shortage of infrastructural facilities, factories and technical know-how, force these countries to sell their raw materials at way cheaper price. They do not manufacture on their own and rely heavily on imports. Further, corruption in governance creates a disparity in the wealth of people. These countries also see the migration of people to other developed countries on a large scale where they try to find a better standard of living for themselves.
High-Income Countries
A good supply of clean water, the presence of excellent health facilities and technologically advanced countries form the group of high-income countries. They import raw material for less price and produce better and more expensive products through their processing units. They have a good trade balance because their imports cost less than their exports. These countries generally have stable governments and the profit is used for the benefit of the people which leads to fewer disparities in health and wealth.
Frequently Asked Questions
What is the purpose of classifying the world population, and what are some common classification criteria?
Classifying the world population helps in demographic analysis and policy formulation. Common criteria include age, gender, ethnicity, nationality, and socioeconomic status.
How does demographic classification contribute to understanding global trends and challenges?
It provides insights into population growth, migration patterns, and distribution, aiding in addressing issues like urbanization, aging populations, and resource allocation.
What are some key demographic trends observed when classifying world population?
Trends include population aging in many countries, population growth in developing regions, and the impact of migration on population distribution.
How does the classification of world population assist governments and organizations in policymaking?
It enables tailored policies and programs to address specific demographic groups’ needs, such as healthcare for the elderly or education for youth.
What challenges and ethical considerations arise when classifying world population?
Challenges include privacy concerns and potential biases in data collection. Ethical considerations involve treating all demographic groups fairly and without discrimination.