


Population

A population is described as the number of all the inhabitants living in an area. The area specified can vary in size from the size of a country to the entire Earth. The population of an area is constantly changed by increases in events like births and immigration, and losses, such as deaths and emigration.
As with all biological populations, the natural population growth of humans is determined by factors such as food supply, diseases, and environmental factors. By studying natural population growth, we learn that the size of human populations is further influenced by social customs that rule over reproduction, as well as developments in technology, medicine, and public health that together lead to a reduction in mortality and the extension of the average life.
Populations, their size, composition, and the rate at which they change are critical elements of human societies. These factors have significant implications on things such as culture, language, family structure, education, health, prosperity, and even crime patterns. Nearly all aspects of human society are affected by the changes in population, and trends in population.
Read more about Population Structure
Population growth

The rate of population growth can be determined by combining the rate of natural increase with the effects of migration. It is then possible for a high rate of natural increase to be offset by a large net out-migration or emigration. Alternatively, it is also possible for a low rate of natural increase to be counteracted by a high level of net in-migration or immigration. However, the effects of migration on a population’s growth rates are far less significant than the effects of changes in fertility and mortality.
Population size and density
Population size is the number of individuals in a given population. Population density is the number of individuals per area or volume of habitat. Population size and population density are two baseline measures important for the assessment of population growth. These two measures are necessary to illustrate and assess the current state of a population. They can also be used to predict a population’s state in the future.
Natural Population Growth
Natural population growth is the difference between the number of live births and deaths of a population within a specified time period. It is otherwise known as natural population change. Natural increase is described as the difference between a population’s birth rate and death rate. A population’s natural population growth may either be positive or negative. An area with higher birth rates than death rates will experience a growth in population. Conversely, an area with higher death rates than birth rates will experience a decrease in population.
Causes of Population Natural Population Growth
Fertility
Fecundity is a person’s biological potential for reproduction. Fertility is the level of reproduction that is actually achieved by an individual. In general, human fertility is limited by factors such as culture, custom, circumstance, and personal choice. This makes fertility significantly lower than fecundity.
Various intervening factors contribute to the difference between fecundity and fertility. These include: (1) women don’t usually reproduce as soon as they hit puberty, (2) not all women who can reproduce actually do so, (3) not all widows remarry, (4) many elements of social behaviour put a restriction on fertility, and (5) human couples often choose to not reproduce through abstinence, contraception, abortion, or sterilisation.
Mortality
Mortality, simply put, is the death of human individuals. In a population, mortality represents loss. The science of demography recognises that although mortality in a population is made up of unpredictable events, there is still a statistical regularity when observed across a large group. A statistical tool known as the life table or mortality table shows how the longevity of members of a population is spread out throughout a period of years.
The life table can be used to effectively compare overall human mortality levels by measuring the life expectancy at birth. This is the number of years a newborn baby is expected to live based on the current mortality rates of people of all ages. In populations before the modern age, life expectancy was as short as 25–30 years of age.
This was largely due to the poor conditions of sanitation and health care during those times. It is estimated that during those times, death tolls were highest during infancy and childhood. In the premodern age, 20 percent of newborns are thought to have died within their first year of life, and 30 percent of children were said to have died before they turned five.
At present, life expectancies have extended way beyond those observed before modern times. In the 1980s, life expectancy in developing countries rose to 55–60 years. Meanwhile, developed countries in western Europe and North America reached as high as 75 years. Additionally, less than 1% of newborn children died within their first 12 months after being born.
The life expectancy of females typically surpasses that of males, although it is not fully understood why this is so. As overall life expectancies have grown throughout the centuries, so did the female advantage. In industrial market economies such as western Europe, North America, Japan, Australia, and New Zealand, this advantage was measured to be seven years in the late 20th century. In the nonmarket economies of eastern Europe, it was a bit higher at eight years.
Effects of fertility and mortality on natural population growth
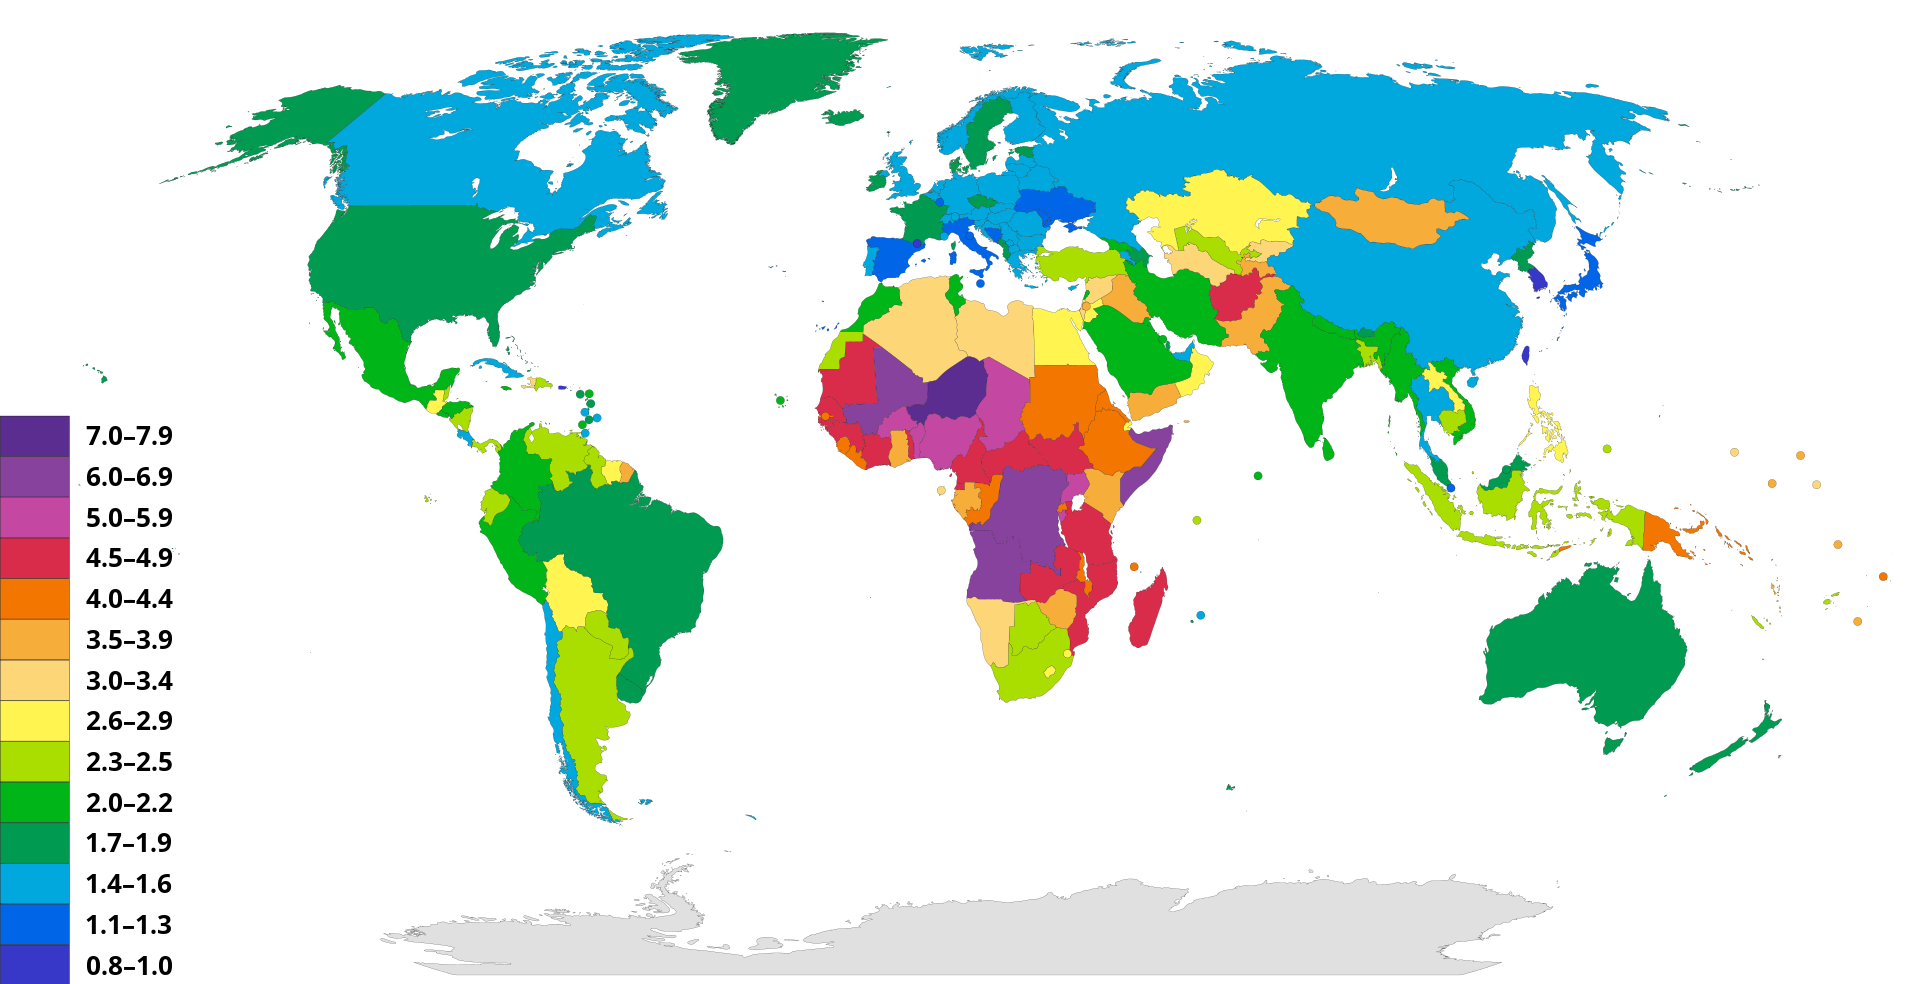
Taking into consideration the characteristics of the human species’ fertility and mortality, natural increase rates are found within a limited range. Nations have rarely gone beyond the natural increase rate of 4% per year. In fact, the highest recorded instance of natural increase was 4.1 in Kenya during the 1980s. At the time, the country experienced very high birth rates alongside low death rates.
In general, the natural increase rates in other developing countries are much lower. During the same time period, these countries averaged 2.5% per annum. In industrialized countries, on the other hand, natural increase rates are even lower. The highest of these countries’ natural increase rates is around 1%. A majority of industrialised countries have natural increase rates that fall in the range of some tenths of 1%. Some even have slightly negative natural increase rates, pointing towards the slow decrease of their population.
Population momentum
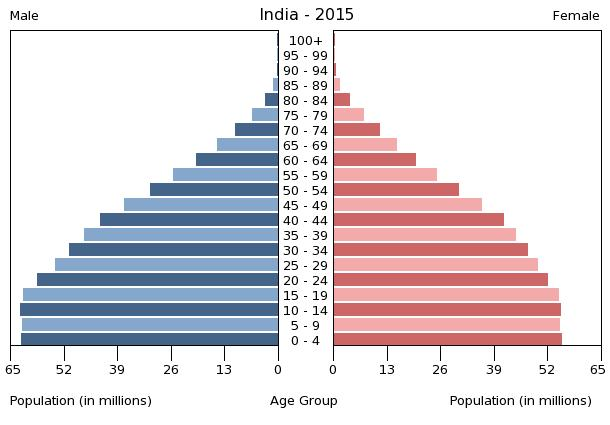
In human populations, highly fertile populations tend to rapidly increase in size and continue to increase even after a significant decline in fertility. This important yet often misunderstood characteristic of human populations is caused by the youthful age structures of these populations.
Highly fertile human populations are composed of large numbers of children yet to mature into adults and reproduce. This explains how even if there is a drastic decline in a population’s fertility, for at least 20 to 30 years, this does not hinder the continuing increase of the number of adults of childbearing age.
Once these large groups eventually age past their childbearing years and into middle age and old age, the decline in their fertility leads to a decline in the number of children as well. In turn, this results in the rate of population growth reaching moderate levels. However, there are also long delays that allow a significant number of additional population growth after the decline of fertility.
This phenomenon is aptly named population momentum. It is also more relevant to developing countries with rapid population growth rates and a limited amount of natural resources. In the 1960s, analysts of population trends ascribed this population growth to the metaphor of a “population bomb”. However, this is currently regarded as a faulty comparison.
A characteristic of bombs is the rapid expense of energy in the form of a great explosion; population growth does not behave in this manner. Instead, a glacier is considered to be a more appropriate metaphor. Like a glacier, rapid population growth moves at a slow pace, yet has immense effects and a momentum that is unstoppable in the long term.
Demographic Transition Model
The Demographic Transition Model shows how developments in a country or region bring changes to its population. It is used to study how a population’s birth and death rates affect the total population in a country or area. In light of this, the Demographic Transition Model only accounts for a population’s natural increase and decrease, and does not include migration and its ability to increase or decrease the size of a population. This model effectively shows how a population changes over time.
Stages

Stage 1
The first stage of the Demographic Transition Model is characterised by a high birth rate and a high death rate. In this stage there is minimal natural increase, leading to a small total population. In the first stage, the population is balanced.
Stage 2
In the second stage, improvement in a country’s healthcare and sanitation have led to the decrease in overall death rates. The country or region would then experience a high birth rate alongside a decreasing death rate. This results in a high natural increase rate, which leads to a growth in population.
Stage 3
The Demographic Transition Model’s third stage features a decreasing birth rate accompanied by a low death rate. In this stage, the rate of natural increase is high, leading to population growth. Another characteristic of the third stage is the narrowing gap between the birth and death rates. This is largely due to the availability of contraception, and a fewer number of children being required to work.
Stage 4
The fourth stage of the Demographic Transition Model is when both the birth rate and death rate of a population are low. These two conditions lead to a slow rate of natural increase and a large total population. In the fourth stage, birth control becomes widely available and easily accessible. People now want to have smaller families.
Stage 5
In the Demographic Transition Model’s fifth stage, a population’s birth rate is now lower than its death rate. This leads to a natural decrease in population. In the fifth stage, the total population remains high, but the ageing population would soon lead to its decline. The desire for smaller families is carried over from the fourth stage, and many individuals opt to have children at a later age.
Frequently Asked Questions
What is natural population growth?
Natural population growth refers to the difference between birth rates and death rates within a population over a specific period, excluding the impact of migration.
How is natural population growth calculated?
Natural population growth is calculated by subtracting the number of deaths from the number of births within a given population during a particular timeframe.
What does a positive natural population growth indicate?
A positive natural population growth indicates that births outnumber deaths, resulting in an increase in the population size.
What does a negative natural population growth indicate?
A negative natural population growth indicates that deaths outnumber births, leading to a decline in the population size.
How does natural population growth impact a country?
Natural population growth affects a country’s demographic makeup, age structure, and future population projections. It has implications for labour markets, healthcare systems, social welfare, and economic development planning.
Resources
An Introduction to Population Growth. (n.d.). Retrieved from Knowledge Project: https://www.nature.com/scitable/knowledge/library/an-introduction-to-population-growth-84225544/
Natural Increase. (n.d.). Retrieved from Centre for Population: https://population.gov.au/population-topics/topic-natural-increase.html
Natural Population Change. (n.d.). Retrieved from Internet Geography: https://www.internetgeography.net/igcse-geography/population-and-settlement-igcse-geography/natural-population-change/
Natural Population Growth. (n.d.). Retrieved from Our World in Data: https://ourworldindata.org/grapher/natural-population-growth?country=~OWID_WRL
Population. (n.d.). Retrieved from Britannica: https://www.britannica.com/science/population-biology-and-anthropology/Natural-increase-and-population-growth
Population Change and Structure. (n.d.). Retrieved from Bitesize: https://www.bbc.co.uk/bitesize/guides/zyxm82p/revision/2
Population size, density, & dispersal. (n.d.). Retrieved from Khan Academy: https://www.khanacademy.org/science/biology/ecology/population-ecology/a/population-size-density-and-dispersal