


People of any country are different in many respects. Each person is different in her/his own way. People can be classified by their age, sex and their residence. Some of the other distinctive traits of the population are profession, education and life prospect.
SEX COMPOSITION
The number of men and women in a country is an essential demographic feature. The ratio between the number of men and women in the population is called the Sex Ratio. Some countries calculate by using the formula:
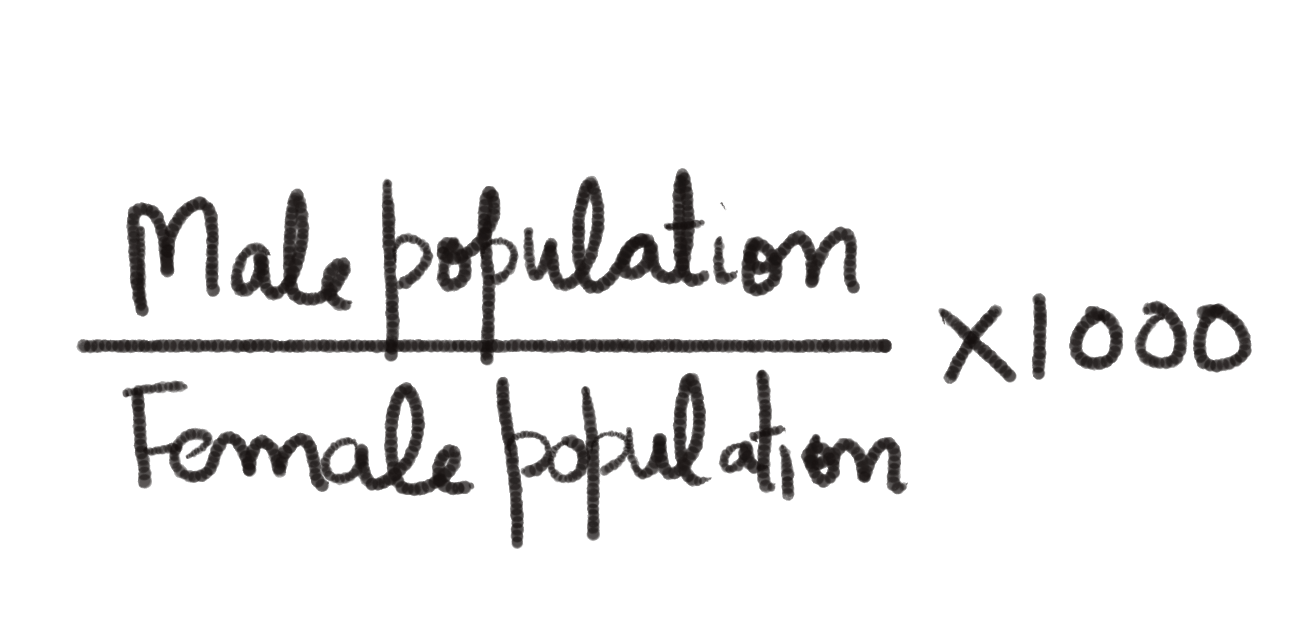
The sex ratio is significant information about the state of women in a country. In countries where gender discrimination is widespread, the sex ratio is bound to be unfavourable to women. Such countries are those where the custom of female foeticide, female infanticide and domestic violence against women are widespread. One of the reasons could be the inferior socio-economic state of women in these regions.
You must recognise that a higher number of women in the population does not mean they have a better situation. It could be that the men have emigrated to other areas for work. On average, the world population reveals a sex ratio of 102 males per 100 females.
Sex composition around the world
- The leading sex ratio in the world has been registered in Latvia where there are 85 males per 100 females. In contradiction, Qatar has 311 males per 100 females. The world model of sex ratio does not present inequalities in the developed regions of the world.
- The sex ratio is agreeable for females in 139 countries of the world and hostile for them in the rest of the 72 countries listed by the United Nations.
- Overall, Asia has a low sex ratio. Countries like India, Afghanistan China, Pakistan, Saudi Arabia have a lower sex ratio. On the other extreme is a larger part of Europe (including Russia) where males are in the minority. A shortage of males in the populations of many European countries is associated with a healthier status of women, and an extremely male-dominated out-migration to different parts of the world in the past.
Age Structure
Age structure depicts the number of people of various age groups. It is a significant indicator of population composition since a large size of the population in the 15- 59 age group shows a huge working population.
A bigger proportion of the population above 60 years signifies an ageing population which requires more expenditure on health care facilities.
Similarly, a high proportion of the youthful population would imply that the region has a high birth rate and the population is young.
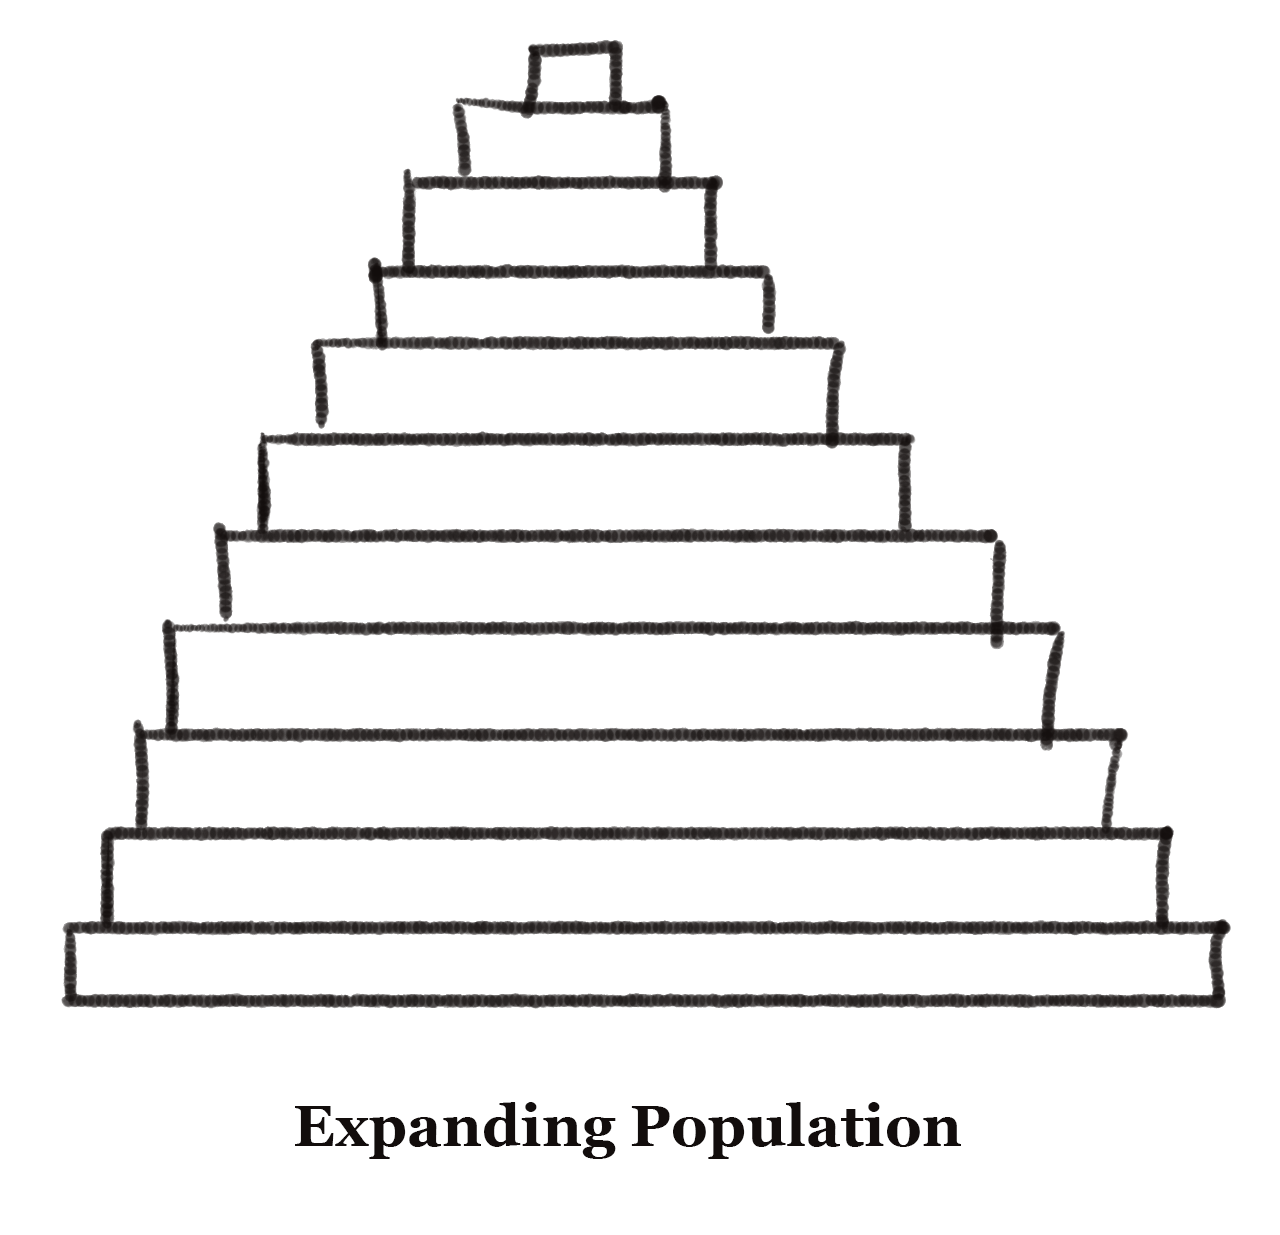
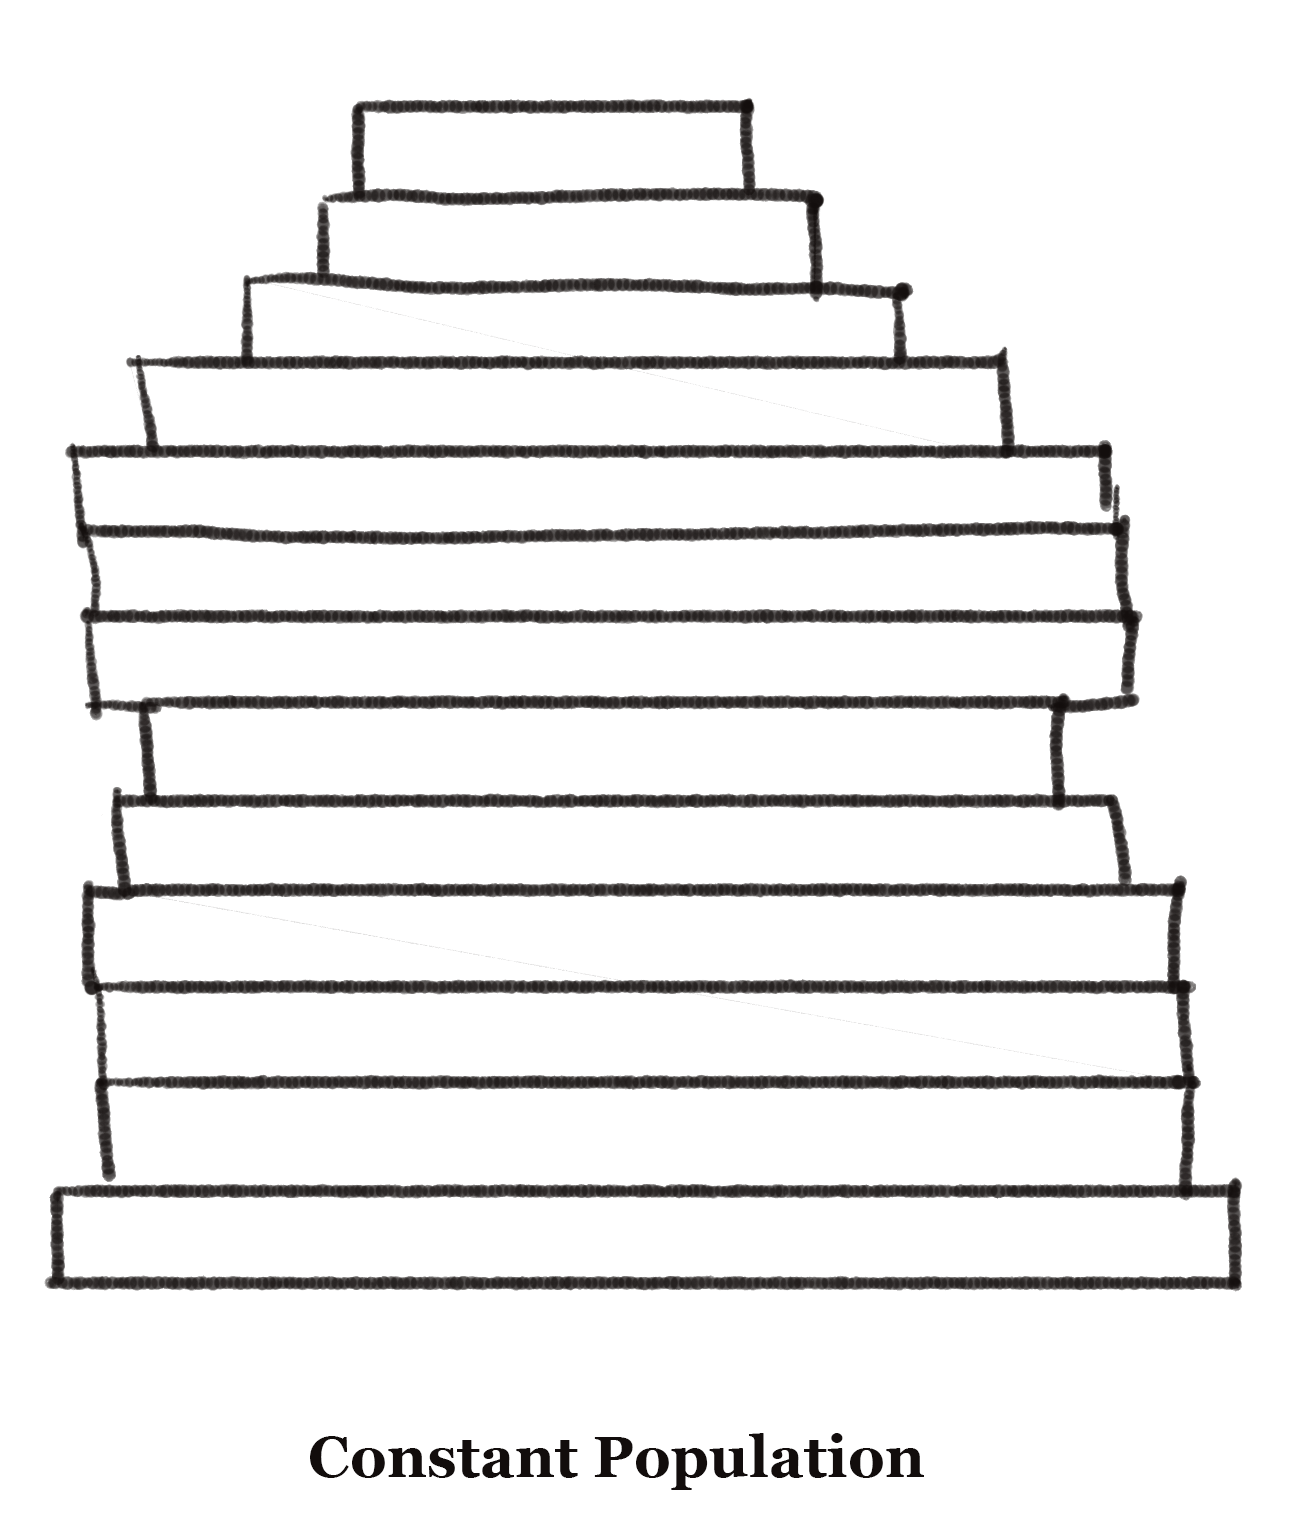
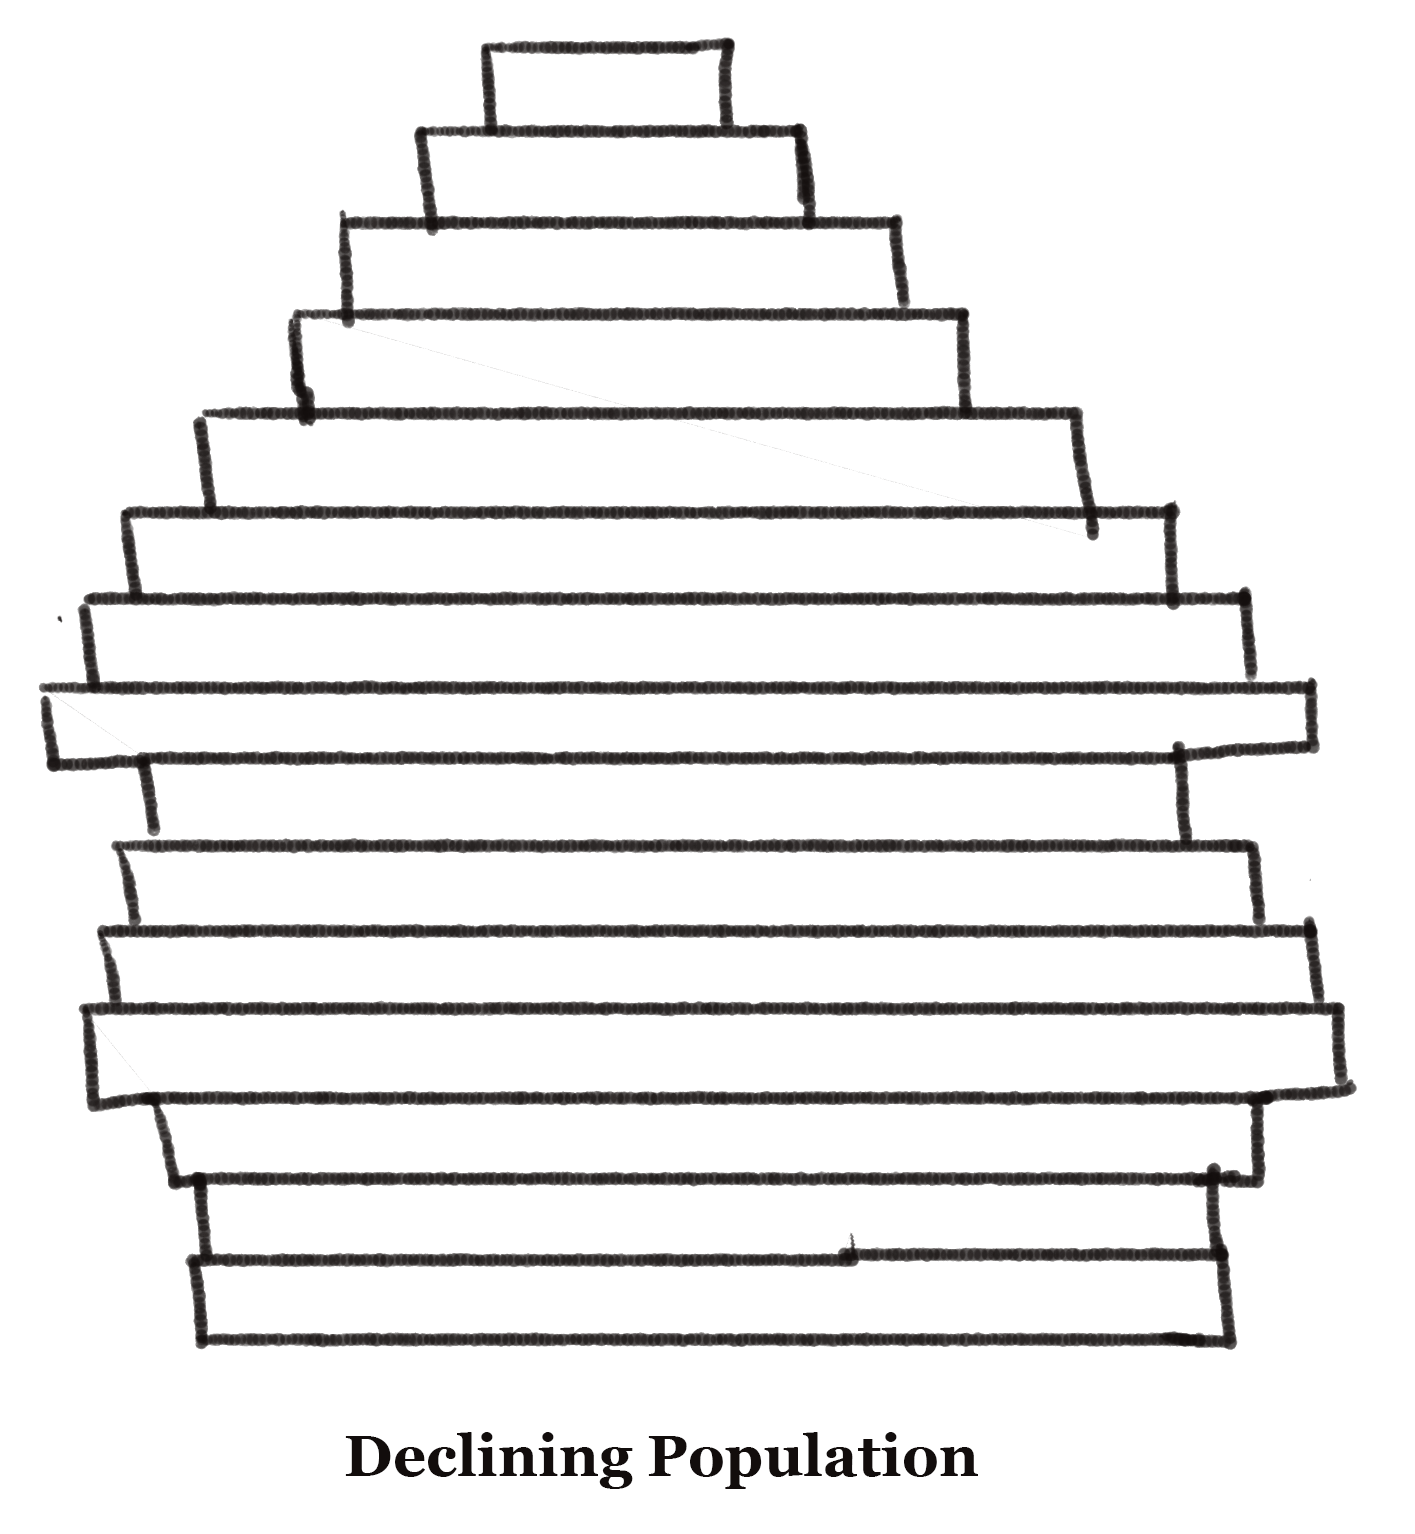
Age-Sex Pyramid
The age-sex structure of a population relates to the number of females and males in various age groups. A population pyramid is used to exhibit the age-sex structure of the population. The shape of the population pyramid shows the features of the population. The left side gives the percentage of males while the right side gives the percentage of women in each age group.
Expanding Populations
Nigeria has a triangular shaped age-sex pyramid with a broad base and is typical of less developed nations. These have substantial populations in lower age groups due to high birth rates. If you form the pyramids for Bangladesh and Mexico, it will look alike.
Constant Population
Australia’s age-sex pyramid is bell-shaped and becomes narrow towards the top. This shows death and birth rates are almost identical leading to a near constant population.
Declining Populations
The Japan pyramid has a narrow bottom and a tapered top pointing low death and birth rates. The population growth in developed nations is usually zero or negative.
RURAL-URBAN COMPOSITION
The division of a population into urban and rural is based on the residence. This division is essential because rural and urban lifestyles vary from each other in terms of their living and social statuses. The age-sex-occupational structure, level of development and density of population differ between urban and rural areas.
The standards for distinguishing rural and urban population differs from country to country. In broad terms, rural areas are those where people are involved in primary activities, and urban areas are those when the majority of the working population is involved in non-primary activities.
The urban and rural differences in sex ratio in West European countries like Finland and Canada are just the contrary of those in Asian and African countries Nepal and Zimbabwe respectively. In Western nations, males outnumber females in rural areas and females outnumber males in urban regions.
In countries like Pakistan, India and Nepal the case is reversed. The surplus of females in urban areas of the U.S.A., Canada and Europe is the result of the entrance of females from rural regions to avail the vast job possibilities. Farming in these developed countries is also profoundly mechanised and persists largely as a male occupation.
Contrary to this, the sex ratio in Asian urban regions remains male dominated due to the supremacy of male migration. It is also worth remarking that in countries like India, female participation in farming activities in a rural area is somewhat high. Shortage of housing, high cost of living, the scarcity of job opportunities and lack of safety in cities, intimidate women into migrating from rural to urban areas.
Literacy Proportion of the educated population of a country in a sign of its socio-economic growth as it unveils the standard of living, social status of females, availability of educational amenities and policies of the government. Level of economic expansion is both a cause and result of literacy. In India, literacy rate expresses the percentage of population above seven years of age, who can read, write and have the capability to do arithmetic computations with understanding.
Occupational Structure
The working population (i.e. men and women of the age group – 15 to 59) take part in several occupations ranging from agriculture, fishing, manufacturing, forestry construction, services, commercial transport, communication and other unclassified services.
Agriculture, mining, fishing and forestry are categorised as primary activities, manufacturing as a secondary activity, and trade, transport, communication and other services as tertiary. The work related to research, information technology and generating ideas as quaternary activities. The proportion of the working population engaged in these four sectors is a good indicator of the levels of economic development of a nation.
This is because only a developed economy with industries and infrastructure can support more workers in the secondary, tertiary and quaternary sector. If the economy is still in the primordial stages, then the proportion of people involved in primary activities world be high as it involves the extraction of natural resources.
Frequently Asked Questions
What is population composition, and what demographic factors are commonly analyzed?
Population composition refers to the structure of a population, including age, gender, ethnicity, education, occupation, and other demographic characteristics.
How does age distribution impact population composition, and what is the significance of a population’s age pyramid?
Age distribution affects a population’s dependency ratio, workforce, and social services. An age pyramid visualizes these distributions, helping in demographic analysis.
Why is understanding population composition essential for governments and policymakers?
It informs decisions related to healthcare, education, labor force planning, and social welfare programs to meet the diverse needs of a population.
Changes can impact healthcare costs, pension systems, labor markets, and social cohesion, necessitating policy adjustments.
How do cultural and ethnic factors contribute to population composition, and what challenges and opportunities can arise from diversity?
Cultural and ethnic diversity can enrich societies but also lead to challenges related to integration, social cohesion, and addressing discrimination and inequality.