Measuring and assessing volcanic activity is a vital pursuit in the field of earth sciences, as it enables scientists to gauge the potential risks associated with volcanic eruptions and to better understand the dynamic processes taking place beneath the Earth’s surface. With the world’s surface punctuated by countless volcanoes, both active and dormant, the need to comprehensively evaluate their behavior is essential for safeguarding human lives and property. This introductory paragraph sets the stage for a comprehensive exploration of the methods, scales, and implications of measuring and assessing volcanic activity, shedding light on the fascinating and sometimes volatile nature of our planet’s geology.
Volcanic Explosivity Index (VEI)
Volcanic eruptions vary dramatically in their intensity, and the Volcanic Explosivity Index (VEI) is a crucial tool in categorizing and understanding their potential for devastation. This index provides a quantitative measure of volcanic explosivity based on the volume of tephra, or volcanic ejecta, produced during an eruption. To put this into perspective, it’s essential to recognize that some volcanic eruptions can be thousands, or even a million times more powerful and hazardous than others.
Volcanic explosivity record
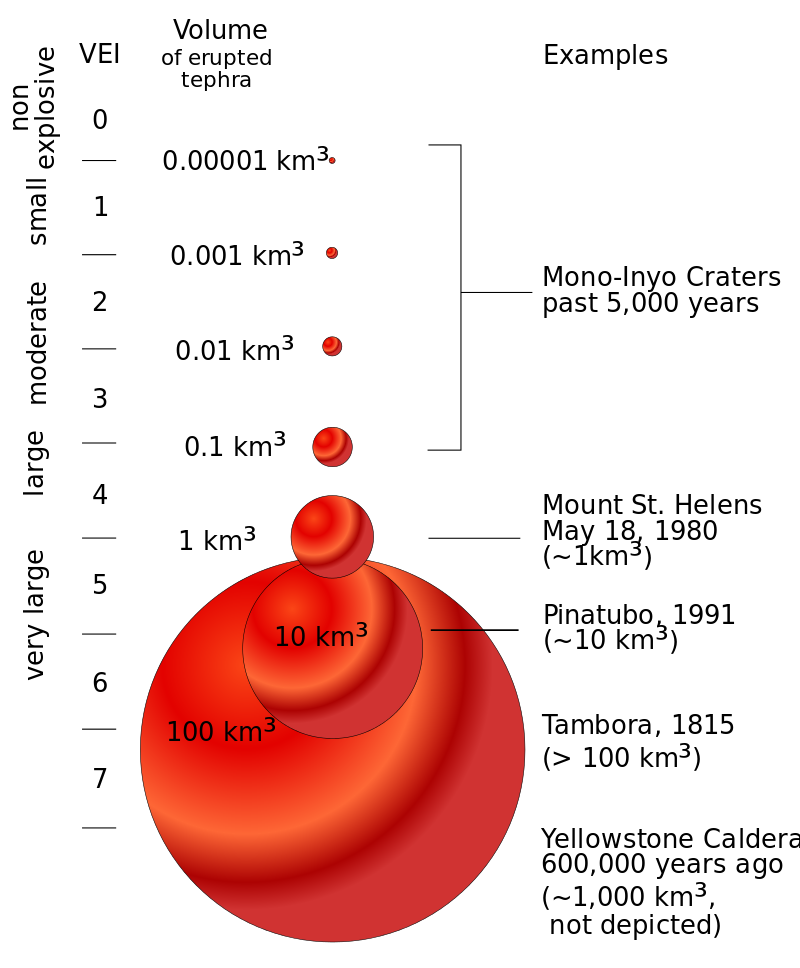
The diagram above illustrates the VEI by showing the relative volume of ejected tephra for some of the most notorious volcanic eruptions in history. While many people associate enormous devastation with well-known eruptions like Vesuvius in 79 AD (the Pompeii eruption), Mount St. Helens in 1980, and Mount Pinatubo in 1991, it’s essential to understand that these events, although significant, pale in comparison to some ancient eruptions.
The ancient eruptions, such as Wah Springs, Toba, Yellowstone, or Long Valley Caldera, far surpass the modern volcanic events in terms of their explosivity. These ancient eruptions ejected enormous volumes of tephra, causing catastrophic impacts on a global scale. Understanding the VEI not only helps us appreciate the sheer magnitude of these historic volcanic events but also allows us to assess the potential risks associated with future eruptions.
Volcanic explosivity index
The VEI provides a standardized way to classify and compare volcanic eruptions based on their tephra output. This index is vital for scientists, volcanologists, and disaster management agencies as it offers a common language to describe the explosivity of eruptions. The circles on the right-hand side of the diagram depict a relative size comparison for each VEI category.
Estimation Scales for Natural Events
For scientists and researchers studying natural phenomena, gauging the size or intensity of various events has been a longstanding challenge. Over time, they’ve developed estimation scales to quantify the magnitude and potential impact of these occurrences. These scales play a crucial role in comparing different events and assessing the potential damage they can cause.
Magnitude Scales for Natural Events:
- Richter Magnitude Scale: The Richter Magnitude scale was introduced to measure the energy released by earthquakes. This scale provides a quantitative assessment of the seismic event’s power, allowing scientists to rank earthquakes according to their magnitude. It’s a valuable tool for understanding and comparing the intensity of seismic events.
- Saffir-Simpson Scale: The Saffir-Simpson scale is used to estimate the potential of tropical storms and hurricanes. This scale categorizes storms into different levels based on their wind speed and provides a clear understanding of their destructive capabilities. It’s instrumental for hurricane tracking and preparedness efforts.
- Fujita Scale: The Fujita scale is employed to rate the intensity of tornadoes. It classifies tornadoes based on the damage they cause, helping researchers and meteorologists understand the destructive power of different tornadoes. This scale is essential for assessing the aftermath of tornadoes and improving storm preparedness.
Challenges in Estimating Volcanic Eruption Strength:
Estimating the strength of a volcanic eruption presents unique challenges compared to assessing events like hurricanes or earthquakes. Volcanic eruptions are incredibly complex, generating a variety of products and displaying a wide range of behaviors. One major hurdle is that volcanic eruptions can be categorized as either explosive (involving the ejection of solid materials) or effusive (involving the flow of liquid lava).
This distinction adds a layer of complexity when attempting to estimate the strength of a volcanic eruption. Explosive eruptions, for instance, pose different hazards than effusive ones. Moreover, eruptions can vary significantly in terms of duration and behavior, making it challenging to apply a one-size-fits-all measurement. Despite these challenges, scientists continue to develop tools and methods to assess volcanic eruptions and gauge their potential impacts, allowing for better preparedness and response in volcanic regions.
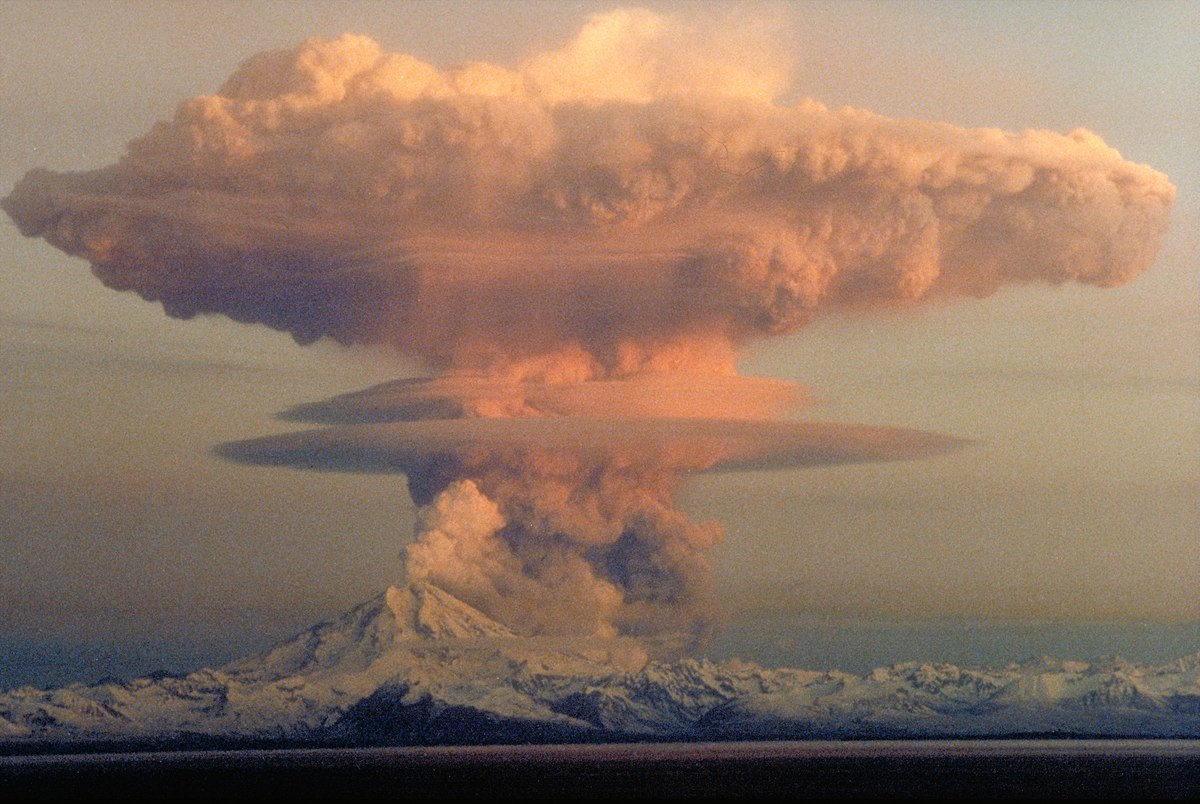
Redoubt eruption: Eruption cloud from Redoubt Volcano, as seen from the Kenai Peninsula. This emission kept going from December 14, 1989, until June 20, 1990. It was just a VEI 3. Toba was around multiple times more hazardous. Photo by R. Clucas, April 21, 1990. USGS picture. Augment. More data.
Estimating Explosive Eruptions
In 1982, Chris Newhall, affiliated with the United States Geological Survey, and Stephen Self from the University of Hawaii, introduced the groundbreaking concept of the Volcanic Explosivity Index (VEI). This relative scale was conceived to enable the comparison of various explosive volcanic eruptions, thereby providing invaluable insights into the dynamics and potential impact of these natural events. What makes the VEI so significant is its versatility; it can be applied to assess both contemporary eruptions that scientists have observed and historical eruptions dating back thousands or even millions of years.
The Core of VEI: Measuring Explosive Volcanic Events
The primary determinant used to calculate the VEI is the volume of pyroclastic material ejected by the erupting volcano. This category of pyroclastic material encompasses a wide range of volcanic ejecta, including volcanic ash, tephra, pyroclastic flows, and other forms of eruptive products. To assign a VEI level to an eruption, both the volume of the ejecta column and the duration of the eruption are meticulously considered. This approach provides a holistic view of the eruption’s explosivity, taking into account not only the amount of material expelled but also the duration over which it occurred.
Unveiling the Power of Wah Springs: A Monumental Eruption
Among the numerous eruptions assessed using the VEI, the Wah Springs eruption has emerged as a striking example of one of the most formidable volcanic events in history. Eric Christiansen and Myron Best, researchers from Brigham Young University, have presented compelling evidence supporting the Wah Springs eruption as potentially being one of the largest, if not the largest, explosive volcanic eruptions ever documented.
This astounding eruption, which unfolded in the annals of geological history, provides a remarkable illustration of the cataclysmic forces nature can unleash. The painstaking research conducted by Christiansen and Best not only helps to position the Wah Springs eruption on the VEI scale but also deepens our understanding of these awe-inspiring geological phenomena. By delving into the past, scientists can gain valuable insights into the potential risks posed by volcanic eruptions and the necessity for preparedness measures in regions susceptible to volcanic activity.
Fish Canyon Tuff
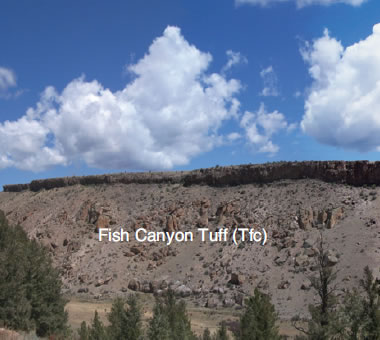
Fish Canyon Tuff: Another VEI 8 eruption that rivals Wah Springs happened around 28 million years ago in what is presently southwestern Colorado. The eruption at La Garita Caldera created the Fish Canyon Tuff, a dacitic ignimbrite, with a unique evaluated volume of around 5,000 cubic kilometres. Picture by USGS. Grow/picture source.
The Volcanic Explosivity Index (VEI) is a remarkable scale that categorizes volcanic eruptions based on their explosivity, offering valuable insights into the magnitude of these geological events. The VEI scale begins at 0 for eruptions that release less than 0.0001 cubic kilometers of ejecta. Most eruptions in this category are relatively small. It’s important to note that some of these eruptions are “effusive” rather than “explosive.” Effusive eruptions are characterized by the gentle release of magma from the vent, as opposed to violent ejections of material.
Eruptions assessed at VEI 1 fall within the range of 0.0001 to 0.001 cubic kilometers of ejecta. Beyond VEI 1, the scale adopts a logarithmic progression, signifying that each step on the scale represents a tenfold increase in the volume of material ejected. VEI 2 eruptions release between 0.001 and 0.01 cubic kilometers of ejecta, while VEI 3 eruptions involve 0.01 to 0.1 cubic kilometers of ejected material. The scale’s progression from VEI 0 to VEI 8 is visually represented on the accompanying graph.
As each step on the VEI scale denotes a tenfold increase in explosivity, the contrast in explosivity between levels is significant. For instance, a VEI 5 eruption is ten times more explosive than a VEI 4. Each advancement in the scale results in a 100-fold increase in explosivity. For instance, a VEI 6 eruption is 100 times more explosive than a VEI 4. A VEI 8 eruption is an astounding one million times more explosive than a VEI 2 eruption. These variations are primarily based on the volume of ejecta expelled during the eruption.
To account for the noticeable difference in eruption size between the lower and upper ends of a stage, a “+” symbol is often added to eruptions that are known to be at the higher end of their respective stage. For example, the eruption of Katla in Southern Iceland on October 12, 1918, was designated as VEI 4+ because it represented an exceptionally strong VEI 4 eruption. This addition of “+” helps to fine-tune the explosivity assessment and provides a more accurate representation of the eruption’s power.
Toba Eruption Site
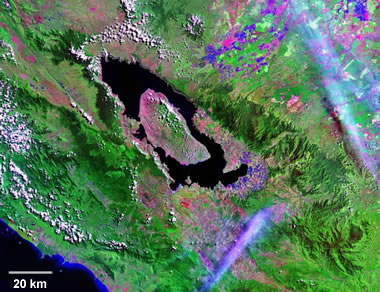
Toba Eruption Site: About 73,000 years ago, a volcano known as Toba erupted on the island of Sumatra, Indonesia. It was one of the most significant volcanic eruptions that can be reported with current proof. The impact is accepted to have deforested portions of India – around 3,000 miles away – and catapulted around 2,600 cubic kilometres of volcanic flotsam and jetsam. Today the pit is the world’s biggest volcanic lake – around 100 kilometres in length and 35 kilometres wide. Picture created utilizing Landsat Geo cover 2000 information from NASA.
What Eruption Has the Highest VEI?
Approximately 50 eruptions have been classified with a VEI of 8, indicating that they unleashed an astonishing 1,000 cubic kilometers or more of ejecta. To put this into perspective, this would be a colossal mass of unconsolidated volcanic material, equivalent to a cube measuring 10 kilometers in length, 10 kilometers in width, and 10 kilometers in depth. Among these awe-inspiring VEI 8 eruptions, three notable ones include the Toba eruption, which occurred 74,000 years ago, the Yellowstone eruption that transpired 640,000 years ago, and the Lake Taupo eruption from approximately 26,500 years ago.
However, the VEI 8 eruption boasting the highest volume of ejecta on record is the ancient Wah Springs eruption, which unfolded in what is now the state of Utah around 30 million years ago. Remarkably, this eruption is estimated to have spewed forth more than 5,500 cubic kilometers of ejecta within a mere seven days.
It’s worth noting that while the Paraná and Etendeka trap volcanic regions witnessed eruptive volumes exceeding 2.6 million cubic kilometers, these eruptions are believed to have been effusive in nature, involving the discharge of liquid basaltic magma rather than the explosive ejections of ejecta. These monumental eruptions occurred around 128 to 138 million years ago and featured extensive lava flows that stretched from eastern Brazil to the western regions of Namibia and Angola. These eruptions were part of the geological history when Africa and South America were once contiguous landmasses.
Mount St. Helens eruption
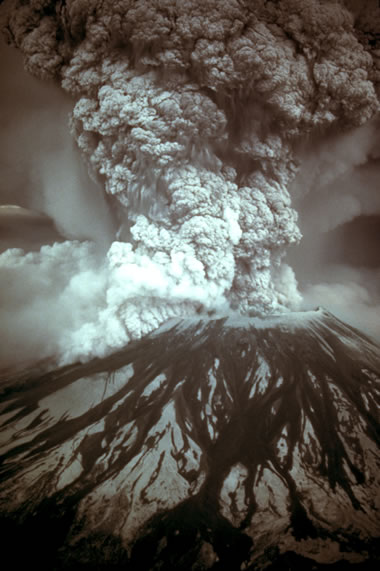
Mount St. Helen’s eruption: The May 18, 1980 eruption at Mount St. Helens was considered by the vast majority to be a large event. The impact expelled the central 400 metres of the mountain, delivered flotsam and torrential jetsam slide that spread 62 square kilometres, and smashed down trees over an area of around 600 square kilometres. This emission was a VEI 4. Toba, at a VEI 8, was multiple times more unstable.
The Frequency of Large Eruptions
VEI Eruption Frequency
VEI
Recurrence
0 frequent
1 frequent
2 tens every year
3 several every year
4 tens every decade
5 one every decade
6 several every century
7 several every thousand years
8 two per 100,000 years
Information from USGS
Much like many natural phenomena, minor volcanic eruptions are relatively common, while significant volcanic events are infrequent. Information provided by the United States Geological Survey (USGS) offers valuable insights into the overall frequency of eruptions categorized by their Volcanic Explosivity Index (VEI). This data not only underscores the rarity of high-VEI eruptions but also emphasizes their potential occurrence.
The organized presentation on this page compiles information from the Global Volcanism Program of the Smithsonian Institution, spanning eruptions that have transpired from roughly 10,000 years ago up to 1994. It reveals a striking contrast in the prevalence of eruptions across different VEI classifications. For instance, the records show that only four eruptions boasting a VEI of 7 have been documented, whereas more than 3,000 events with a VEI of 2 have occurred. Fortunately, the data emphasizes that massive volcanic eruptions are indeed a rare phenomenon.
VEI versus eruption recurrence
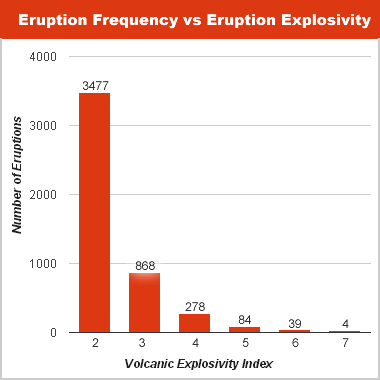
VEI Compared to Eruption Frequency: This chart illustrates the marked disparity in the frequency of volcanic eruptions, with smaller and less explosive events being significantly more common than major ones. The data underpinning this graph is derived from the Global Volcanism Program database maintained by the Smithsonian Institution, encompassing both recorded and historical eruptions spanning from approximately 10,000 years ago to 1994.
Evaluating Ejecta Volumes
Debris Thickness at 16 km
VEI
Thickness
0 nil
1 dusting
2 a barely any centimeters
3 several centimeters
4 a barely any many centimeters
5 about 1/2 meter
6 about three meters
7 at least a few meters
Information from USGS for Measuring and Assessing Volcanic Activity
When a volcanic eruption of explosive nature takes place, the ejecta, which comprises various volcanic materials, is propelled by the force of the explosion and carried by the prevailing winds. Typically, the ejecta is most densely concentrated near the eruption source and progressively thins out as distance from the source increases.
In contemporary eruptions, modern observers have the advantage of collecting data on ejecta thickness from various locations, enabling the creation of contour maps illustrating the distribution of ejecta thickness. This invaluable information is then leveraged to estimate the total volume of ejecta produced by the eruption.
However, the task of accurately estimating ejecta volumes becomes increasingly challenging when eruptions occur in remote or isolated areas. This challenge is further magnified when eruptions unfold on distant islands, far removed from other landmasses. In such cases, eruption cloud size and eruption duration are combined with debris data to establish a Volcanic Explosivity Index (VEI) rating.
The same challenges persist when attempting to calculate ejecta volumes for ancient eruptions. Over time, ejecta can erode or become obscured by more recent volcanic materials. In such situations, geologists and volcanologists rely on their “best estimates.” When the assignment of a specific VEI becomes particularly difficult due to a lack of comprehensive data, it is not uncommon to append a question mark to the VEI number, indicating the level of uncertainty. As an example, the Global Volcanism Project designates the VEI of the eruption of Italy’s Vesuvius on October 24, 79 AD, as “5?” due to the limitations in available data that give rise to uncertainty.
The question arises: why does the VEI scale culminate at VEI 8? The answer lies in the fact that the largest and most explosive eruptions documented in history have attained a VEI rating of 8. This raises intriguing questions about the potential for eruptions even greater than those witnessed at locations like Toba and Yellowstone, both classified as VEI 8 events. Is it within the Earth’s capacity to unleash an eruption that ejects a colossal 10,000 cubic kilometers of material, the threshold for a VEI 9 eruption?
While it is theoretically possible that evidence for a VEI 9 eruption exists, it may be deeply buried in the geological record. Such eruptions, if they occurred, would be exceedingly rare and could indeed pose a substantial threat to life on Earth. The investigation into the possibility of these extremely rare and cataclysmic events continues to captivate the interest of geologists, volcanologists, and the scientific community as a whole.
Frequently Asked Questions
How is volcanic activity measured?
Volcanic activity is measured using various tools such as seismometers to detect earthquakes, gas sensors to monitor emissions, and satellite imagery to track changes in surface features.
What is the Volcanic Explosivity Index (VEI)?
The VEI quantifies the explosiveness of volcanic eruptions based on factors like eruption cloud height, volume of ejected material, and energy released.
How do scientists assess the likelihood of a volcanic eruption?
Scientists analyze seismic activity patterns, changes in gas emissions, ground deformation, and historical eruption data to assess the potential for an upcoming volcanic eruption.
What is pyroclastic flow, and why is it important in volcanic activity assessment?
Pyroclastic flows are fast-moving, hot mixtures of gas, ash, and volcanic rocks. Their occurrence during an eruption can be a significant hazard and indicates increased volcanic activity.
How does volcanic activity impact the surrounding environment and communities?
Volcanic activity can lead to ashfall, lahars (mudflows), pyroclastic flows, and lava flows, all of which pose threats to human settlements, agriculture, and infrastructure.
References
- Volcanic Eruptions and Their Repose, Unrest, Precursors, and Timing (2017) . (n.d.). Retrieved from NAP.EDU: https://www.nap.edu/read/24650/chapter/4
- Measuring volcanic eruptions. (n.d.). Retrieved from JKGeography: https://www.jkgeography.com/how-are-volcanic-eruptions-measured.html
- Volcanic Explosivity Index (VEI). (n.d.). Retrieved from Geology.com: https://geology.com/stories/13/volcanic-explosivity-index/
- Volcanoes. (n.d.). Retrieved from BBC.Co: https://www.bbc.co.uk/bitesize/guides/z8p9j6f/revision/5
- Volcanic explosivity index