


Population
A population is defined as the sum of all inhabitants that live in an area. This number is constantly varying as factors such as births and immigrations increase, and factors such as deaths and emigration decrease. Like all biological populations, a human population can only grow as large as external factors allow. Food supply, disease, and environmental factors limit the size of human populations. Additionally, world population growth is also influenced by artificial factors. A few examples of these are social customs regarding reproduction and technological developments in medicine and public health.
The Earth’s resources are not equally distributed across the globe. The same goes for human populations. The study of the population allows geographers to determine where people live, and why people live there. Geographers focus primarily on three elements in regard to a population’s growth: its size, the rate at which it increases, and its unequal distribution.
Check out our GCSE and A-level Human Geography Teaching Materials!
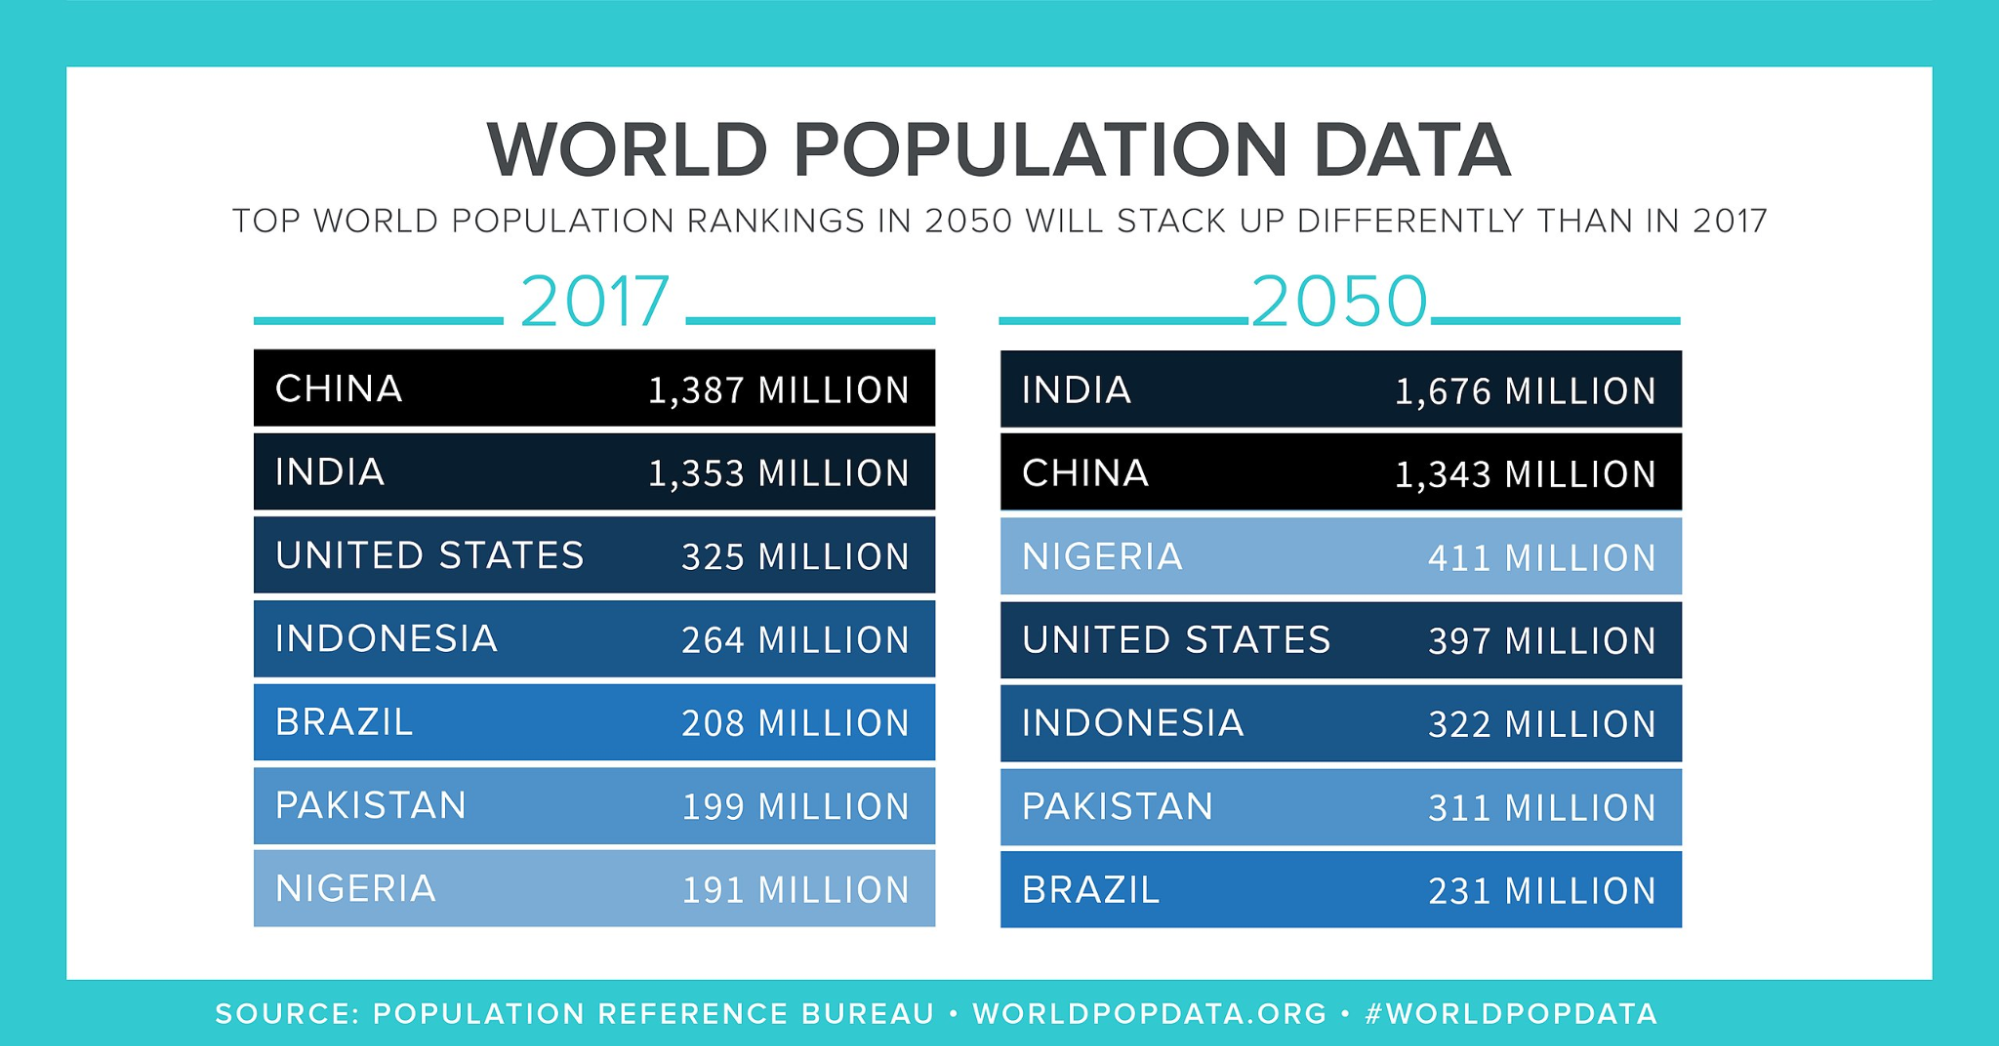
The study of the human population is most relevant in our context today. Human populations, in developing countries especially, have boomed over the past 100 years. Currently, there are more than seven billion people living on this planet. The Earth’s geography puts a limit on the places where humans can settle down and inhabit, hence this number is not distributed evenly over the world. Instead, humans live in clusters, with some areas having a denser concentration of inhabitants. Most of the world’s human population – around two-thirds – lives in three large clusters: East Asia, South Asia, and Europe.
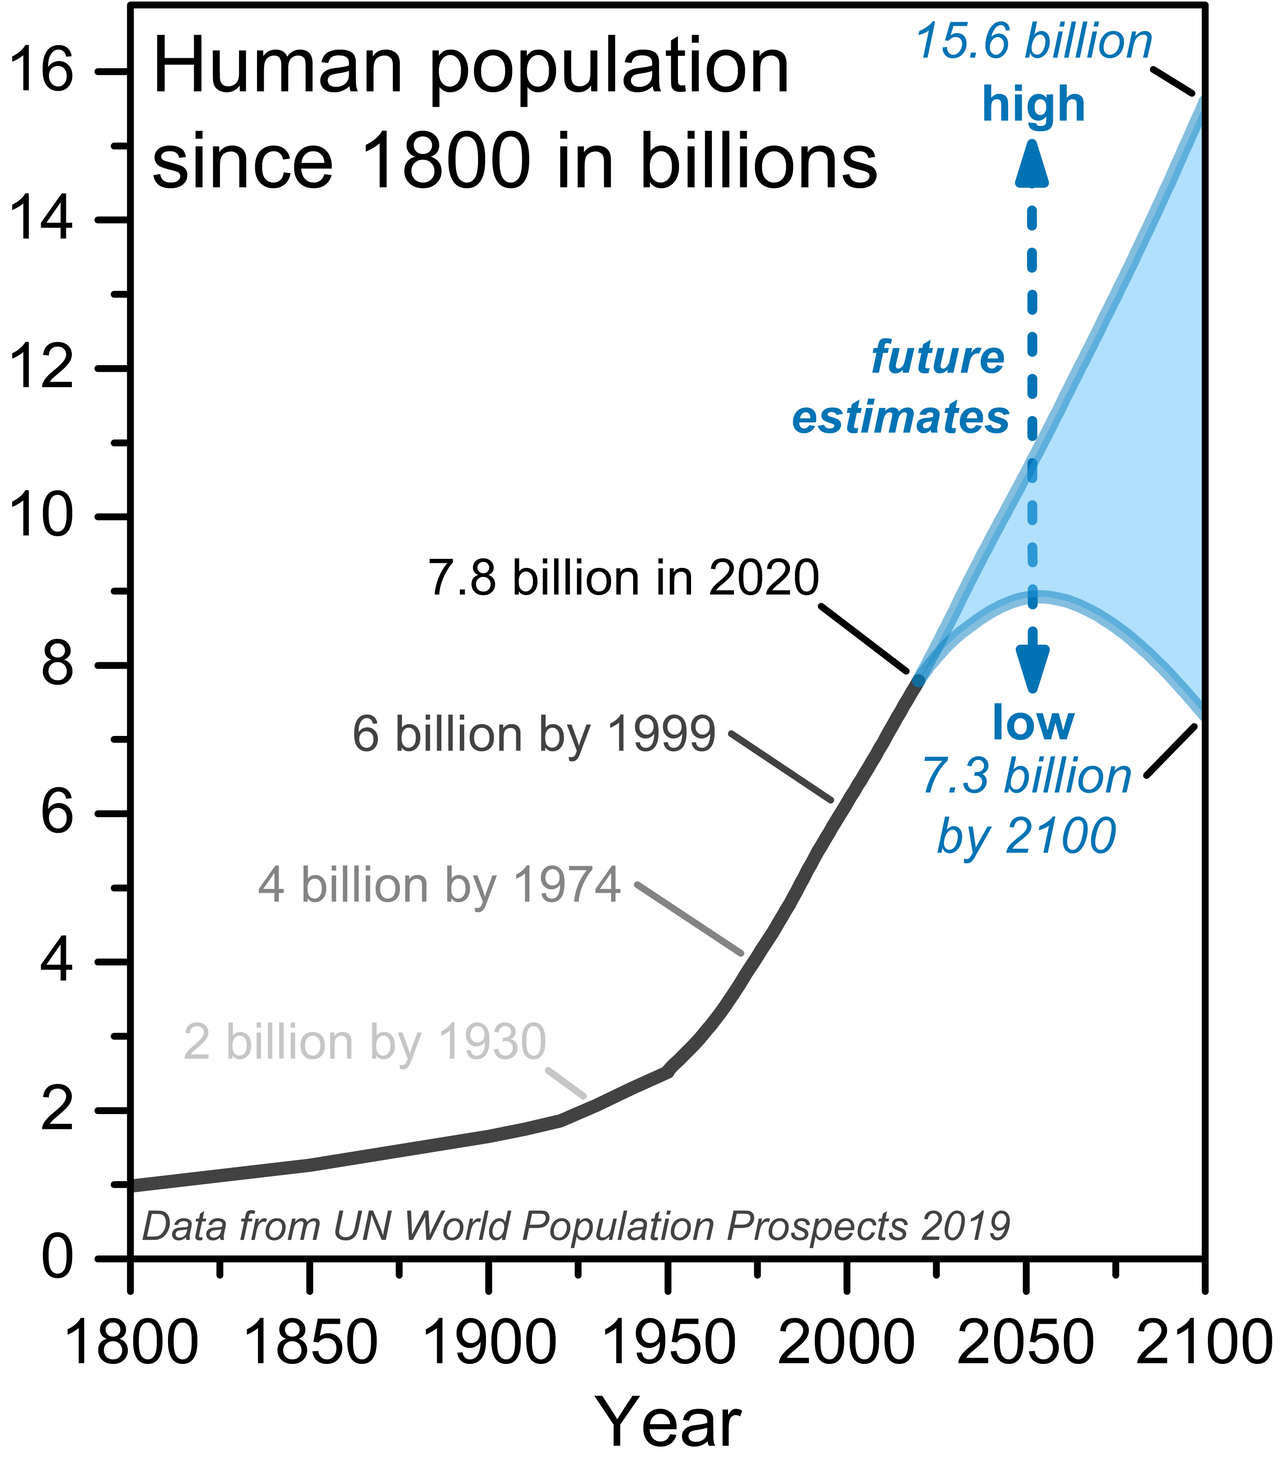
Overpopulation poses significant risks to our planet. The Earth only has a certain carrying capacity in which it can comfortably support life. However, ecologists propose that a great number of human populations have already exceeded this carrying capacity. At present, the Earth does not have enough resources to support every individual if they were to live the average American lifestyle. It is estimated that by the year 2100, the human population would reach 9 billion.
Factors that Influence Population Change
Fertility
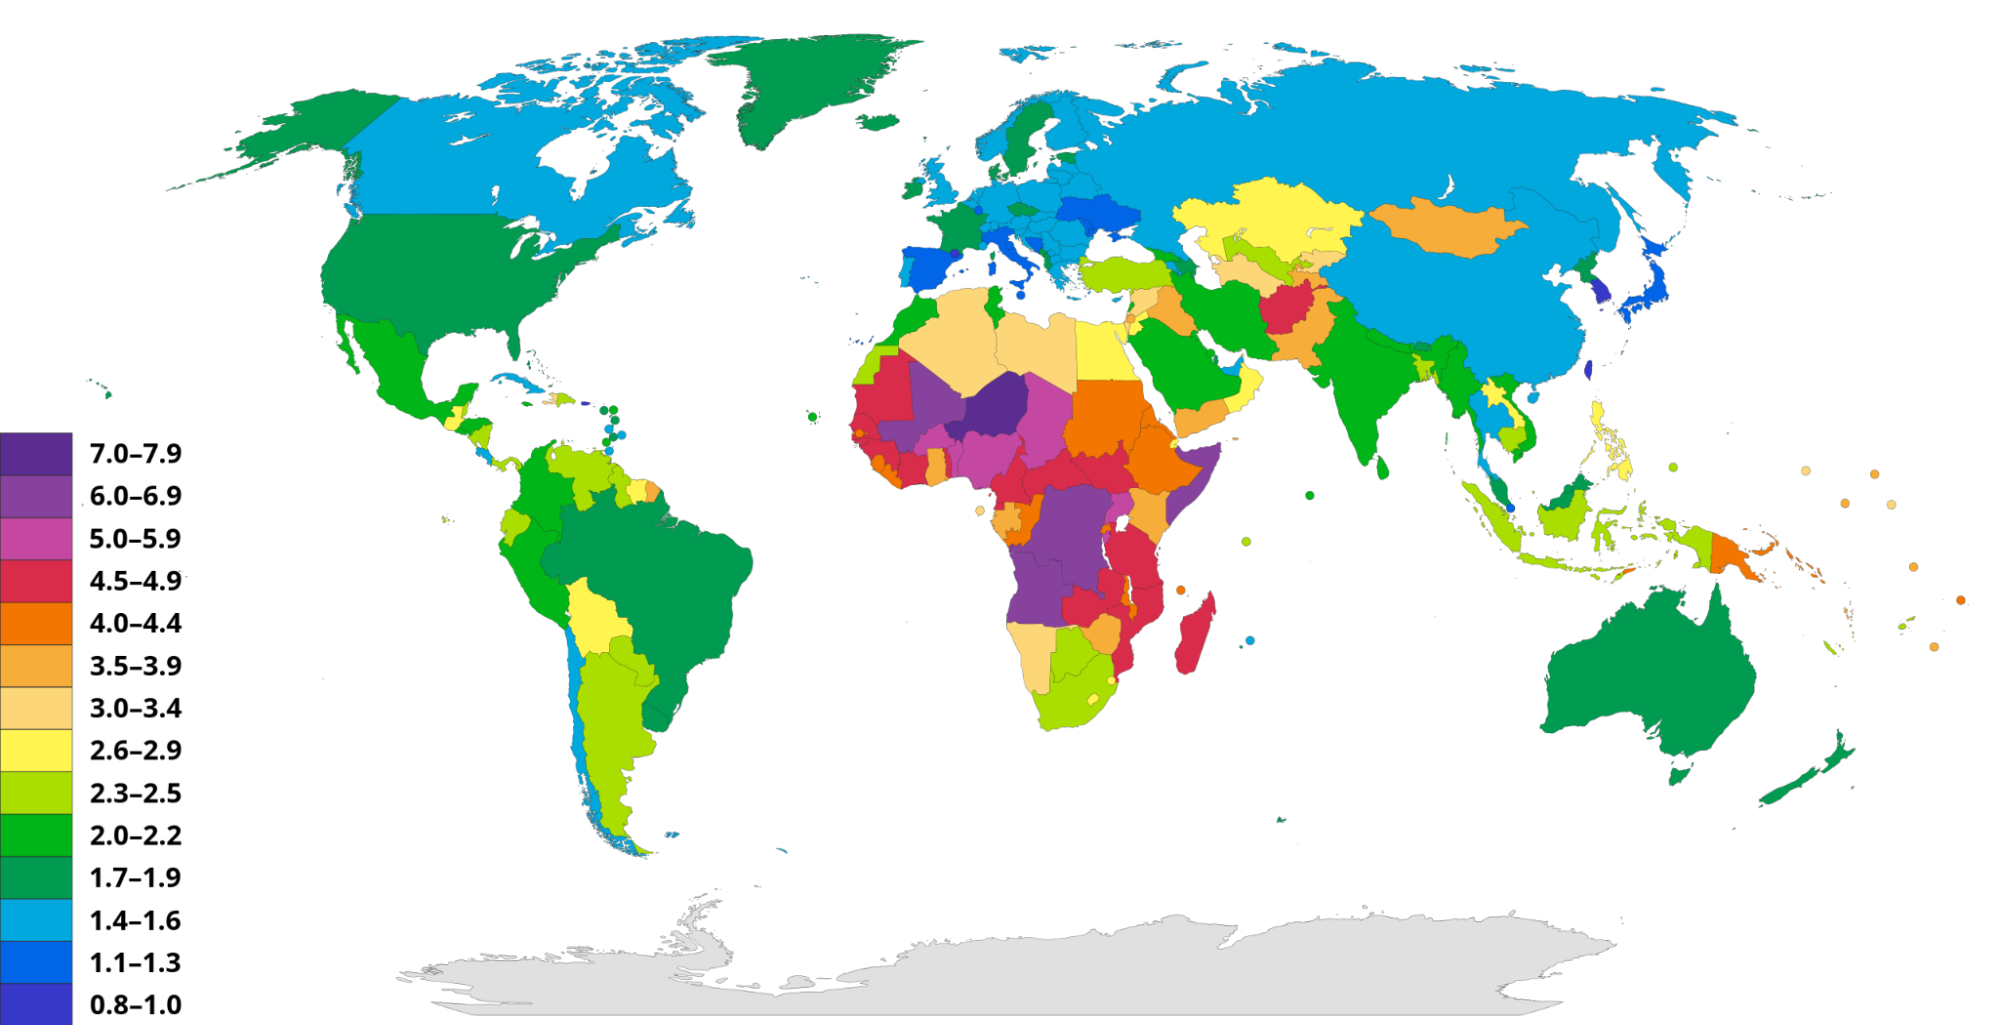
The fertility rate of countries as of 2020.
Fecundity is a person’s biological potential for reproduction. On the other hand, fertility is the level of reproduction that is actually achieved by an individual. In general, human fertility is limited by factors such as culture, custom, circumstance, and personal choice. This makes fertility significantly lower than fecundity.
Various intervening factors contribute to the difference between fecundity and fertility. These include: (1) women don’t usually reproduce as soon as they hit puberty, (2) not all women who can reproduce actually do so, (3) not all widows remarry, (4) many elements of social behaviour put a restriction on fertility, and (5) human couples often choose to not reproduce through abstinence, contraception, abortion, or sterilisation.
Mortality
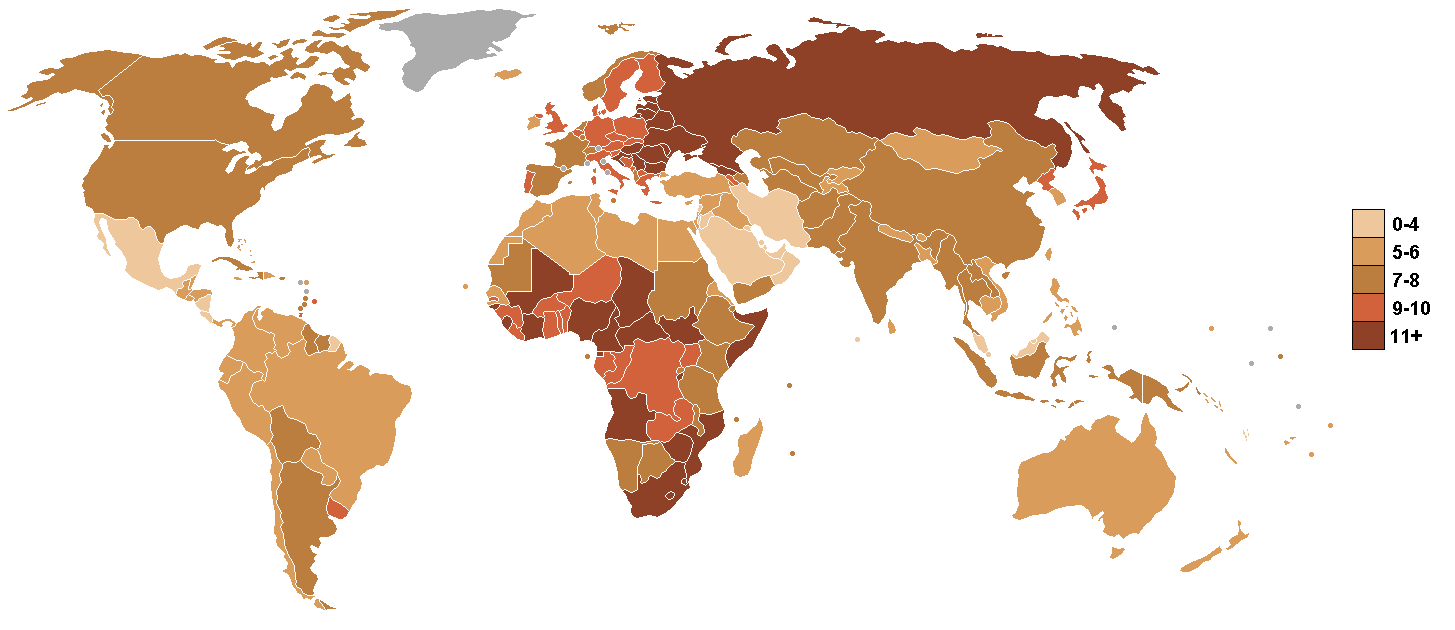
The crude death rates of countries presented per thousand persons per year. Based on WHO data from 2000-2005.
Mortality, simply put, is the death of human individuals. In a population, mortality represents a loss. The science of demography recognises that although mortality in a population is made up of unpredictable events, there is still a statistical regularity when observed across a large group. A statistical tool known as the life table or mortality table shows how the longevity of members of a population is spread out over a period of years.
The life table can be used to effectively compare overall human mortality levels by measuring life expectancy at birth. This is the number of years a newborn baby is expected to live based on the current mortality rates of people of all ages. In populations before the modern age, life expectancy was as short as 25–30 years of age. This was largely due to the poor conditions of sanitation and healthcare during those times. It is estimated that during those times, death tolls were highest during infancy and childhood. In the premodern age, 20% of newborns are thought to have died within their first year of life, and 30% of children were said to have died before they turned five.
At present, life expectancies have extended way beyond those observed before modern times. In the 1980s, life expectancy in developing countries rose to 55–60 years. Meanwhile, developed countries in western Europe and North America reached as high as 75 years. Additionally, less than 1% of newborn children died within their first 12 months after being born.
The life expectancy of females typically surpasses that of males, although it is not fully understood why this is so. As overall life expectancies have grown throughout the centuries, so did the female advantage. In industrial market economies such as western Europe, North America, Japan, Australia, and New Zealand, this advantage was measured to be seven years in the late 20th century. In the nonmarket economies of eastern Europe, it was a bit higher at eight years.
Marriage
Marriage, marital disruption, and its patterns are major factors that affect fertility and explain differences in fertility among various societies. In many Asian and African societies, women are married around the age of 17, soon after their sexual maturation. On the other hand, marrying later has long been common practice in European societies. On average, Europeans first get married at around 25 years of age.
The 20th century has witnessed significant changes in how marital dissolution can be caused by widowhood and divorce. Historically, widowhood has always been a usual occurrence in all societies. However, the decline in mortality rates has dampened its effects on fertility. Divorce, on the other hand, has now become commonplace. In some countries, divorce terminates many marriages. Together, both widowhood and divorce are responsible for the dissolution of 20–50% of marriages in the potential reproductive years of couples.
Migration
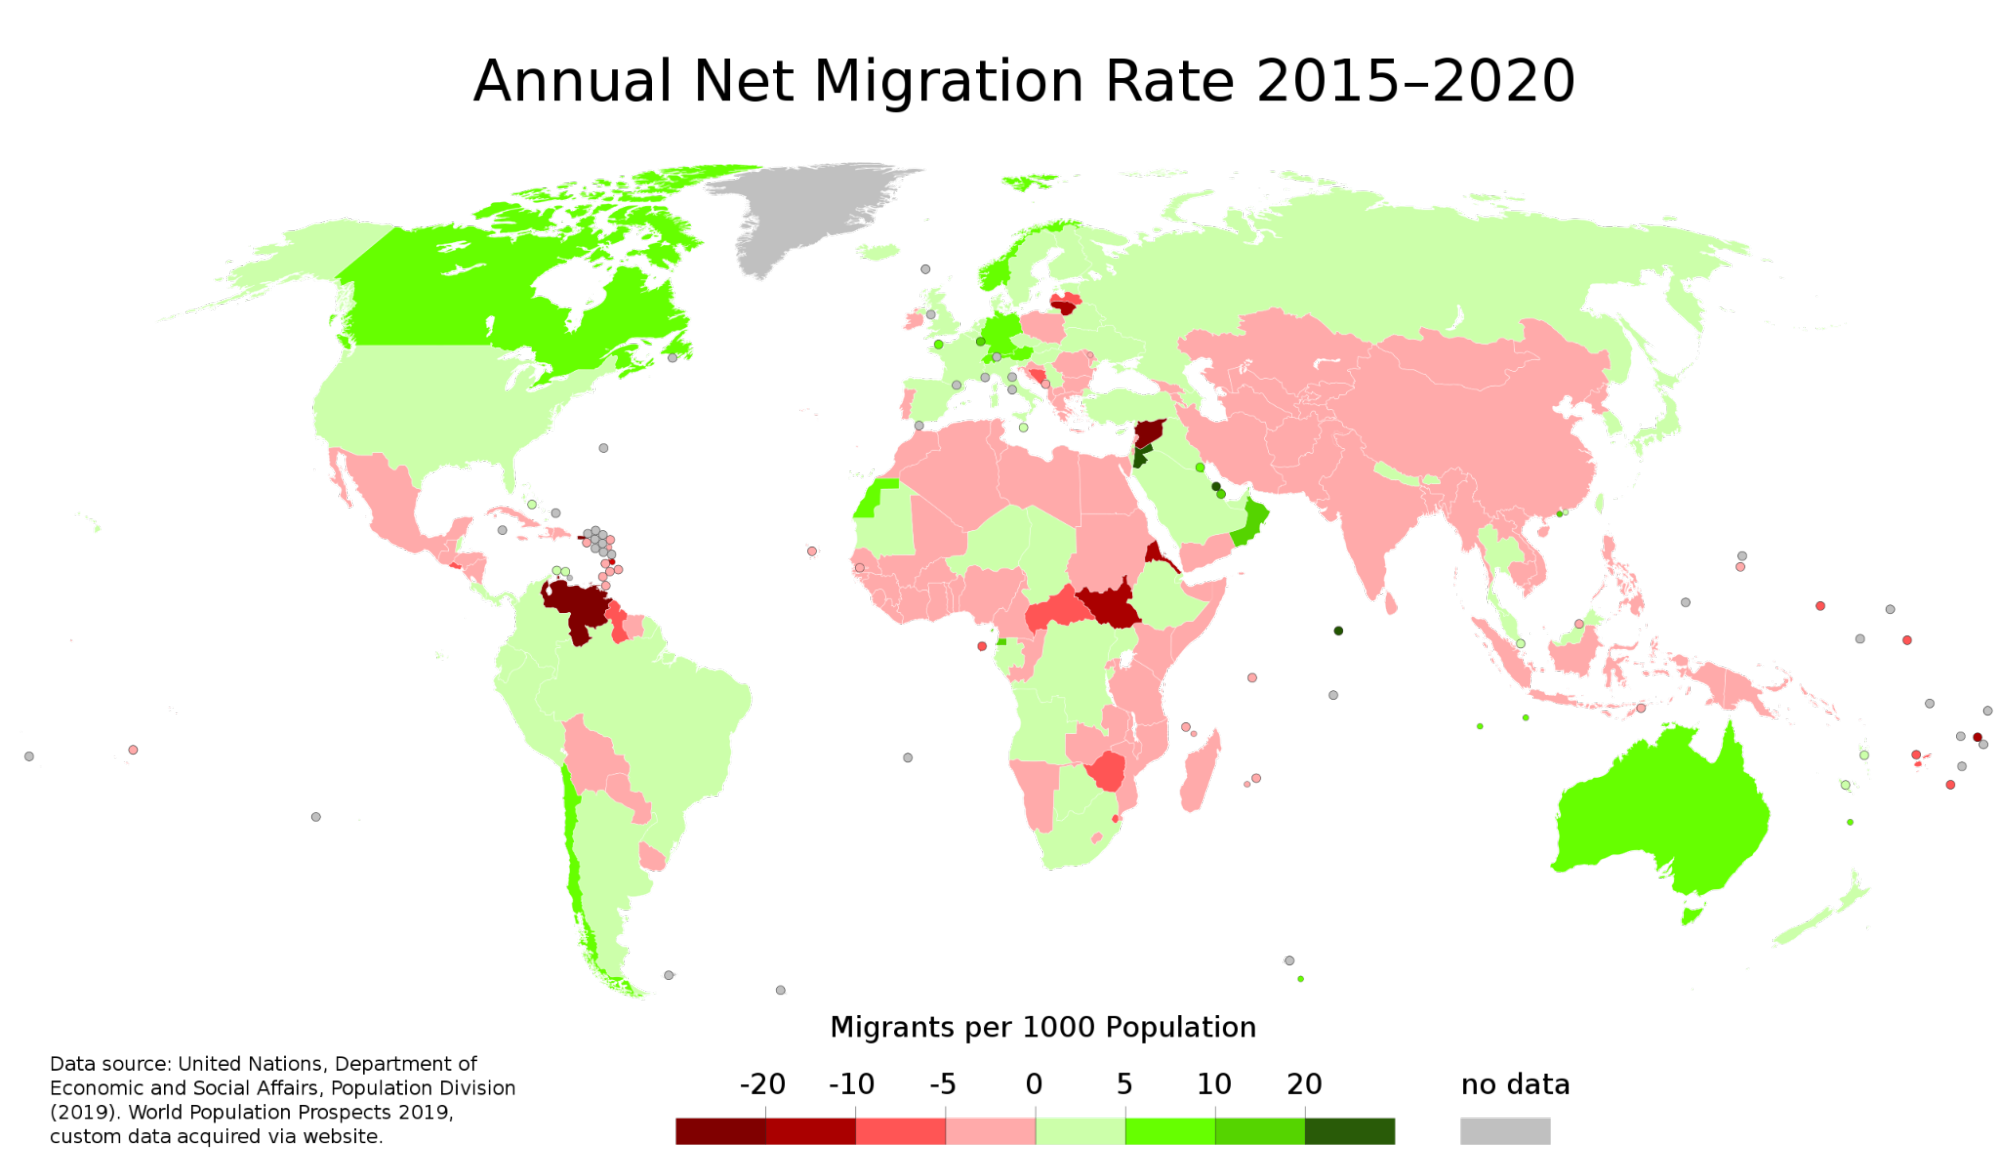
Migration is defined as one’s permanent change of residence for at least one year. The size of populations can either be made larger by people moving in to live in an area or smaller by people moving out to live somewhere else. Migration, immigration, and emigration are important factors to consider when analysing population change.
Human history has been shaped by many great migrations throughout the millennia. However, these were usually the products of periods of suffering, destruction, violence, upheaval, bondage, genocide, and the loss of countless lives.
Natural Increase
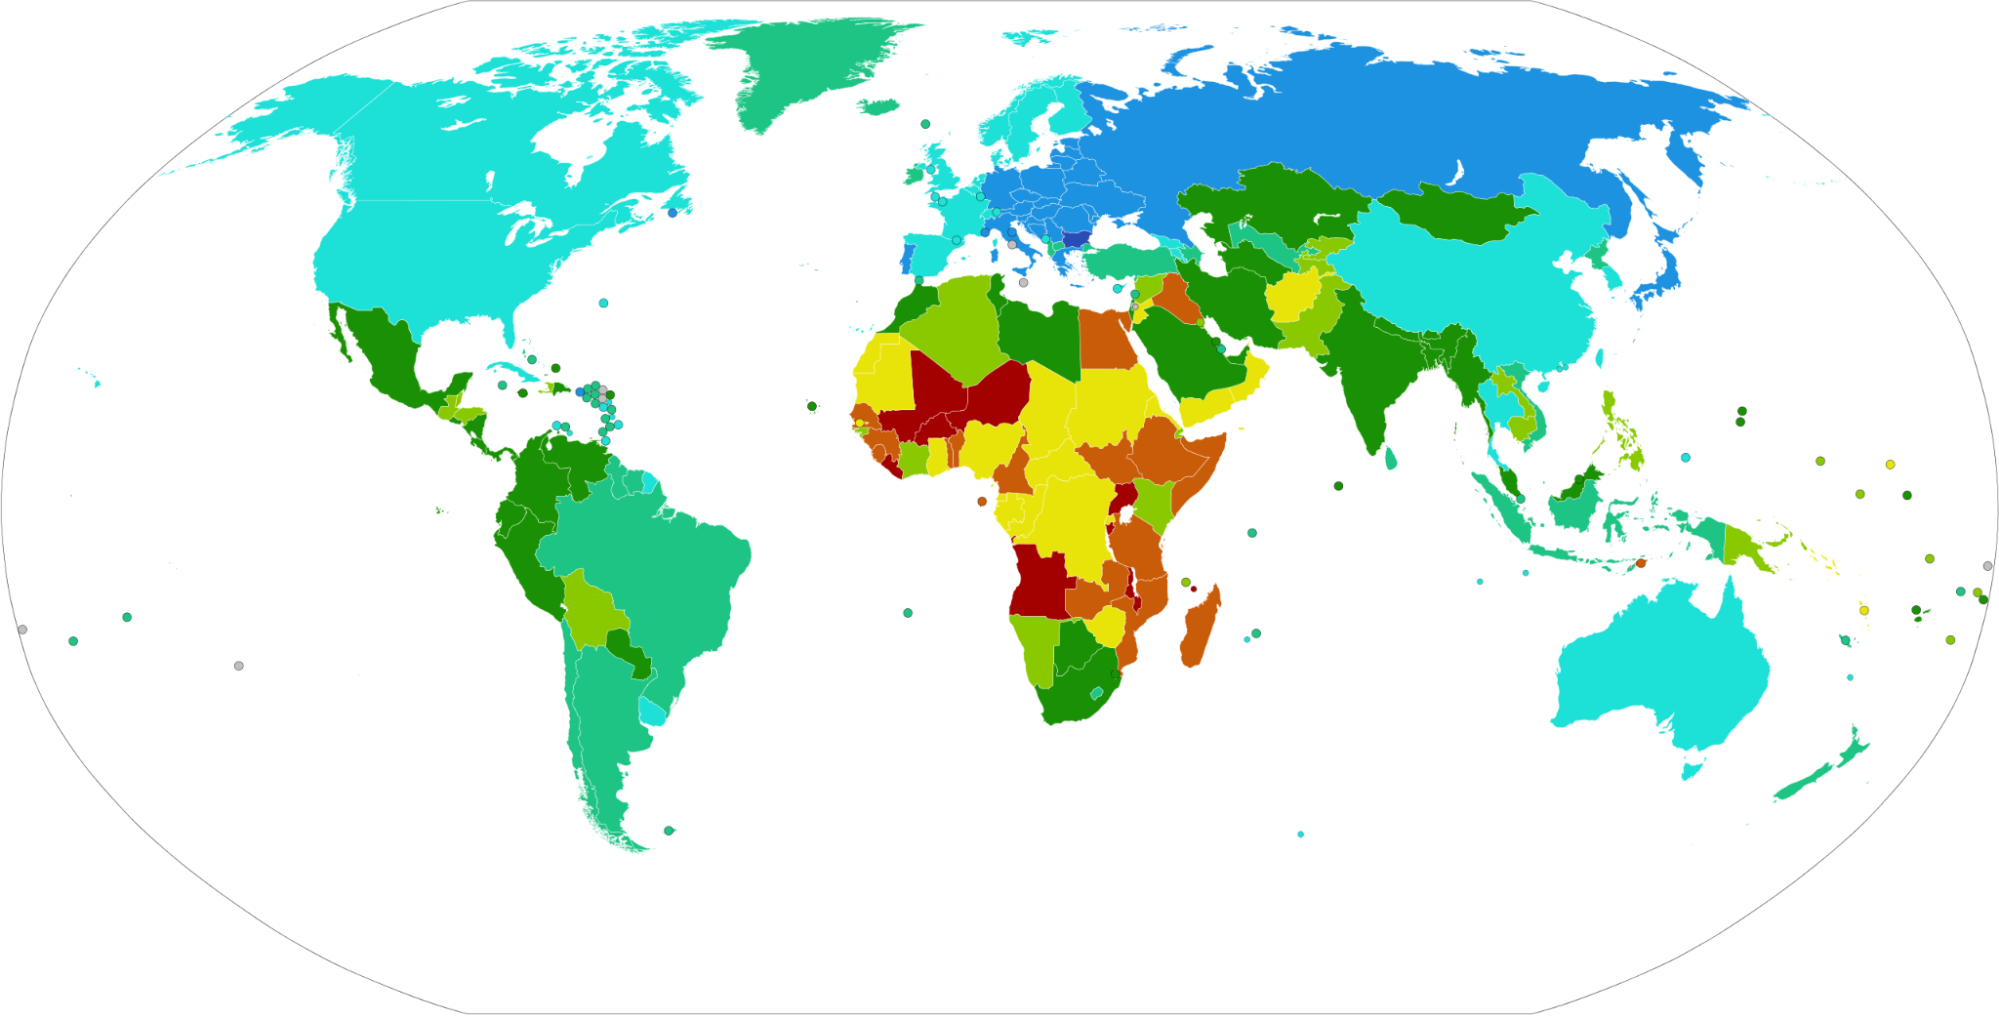
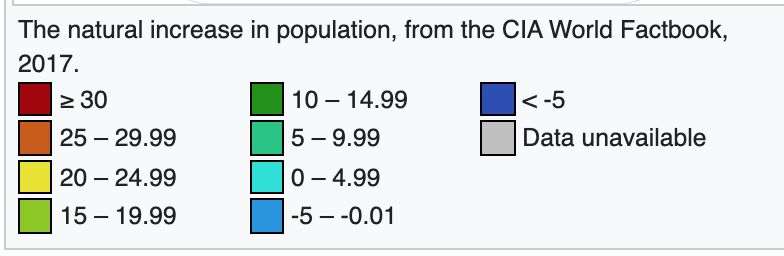
Natural increase is simply the difference between the number of births and deaths in a given population. The rate of natural increase can be determined by finding the difference between the birth rate and the death rate. Natural increase rates usually fall within a narrow range. National populations rarely experience natural increase rates past 4% per annum, the highest being recorded in Kenya during the 1980s. This was due to the combination of an exceptionally high birth rate and a very low death rate. Developing countries usually average at lower natural increase rates. In that year, developing countries usually had a rate of 2.5. In industrialised countries, natural increase rates are even lower at an average of less than 1%. Some even have rates that are slightly negative, pointing towards the decrease in their population.
Population Growth
When the effects of migration are taken into account, the rate of natural increase becomes the rate of population growth. Therefore, a nation’s high natural increase rate can be counteracted by a large net of outmigration or emigration. Conversely, a nation’s low rate of natural increase can be neutralised by high net in-migration or immigration. However, the effects of migration generally have little impact on a population in comparison to the effects of fertility and mortality.
Elements that Comprise Population
Age distribution
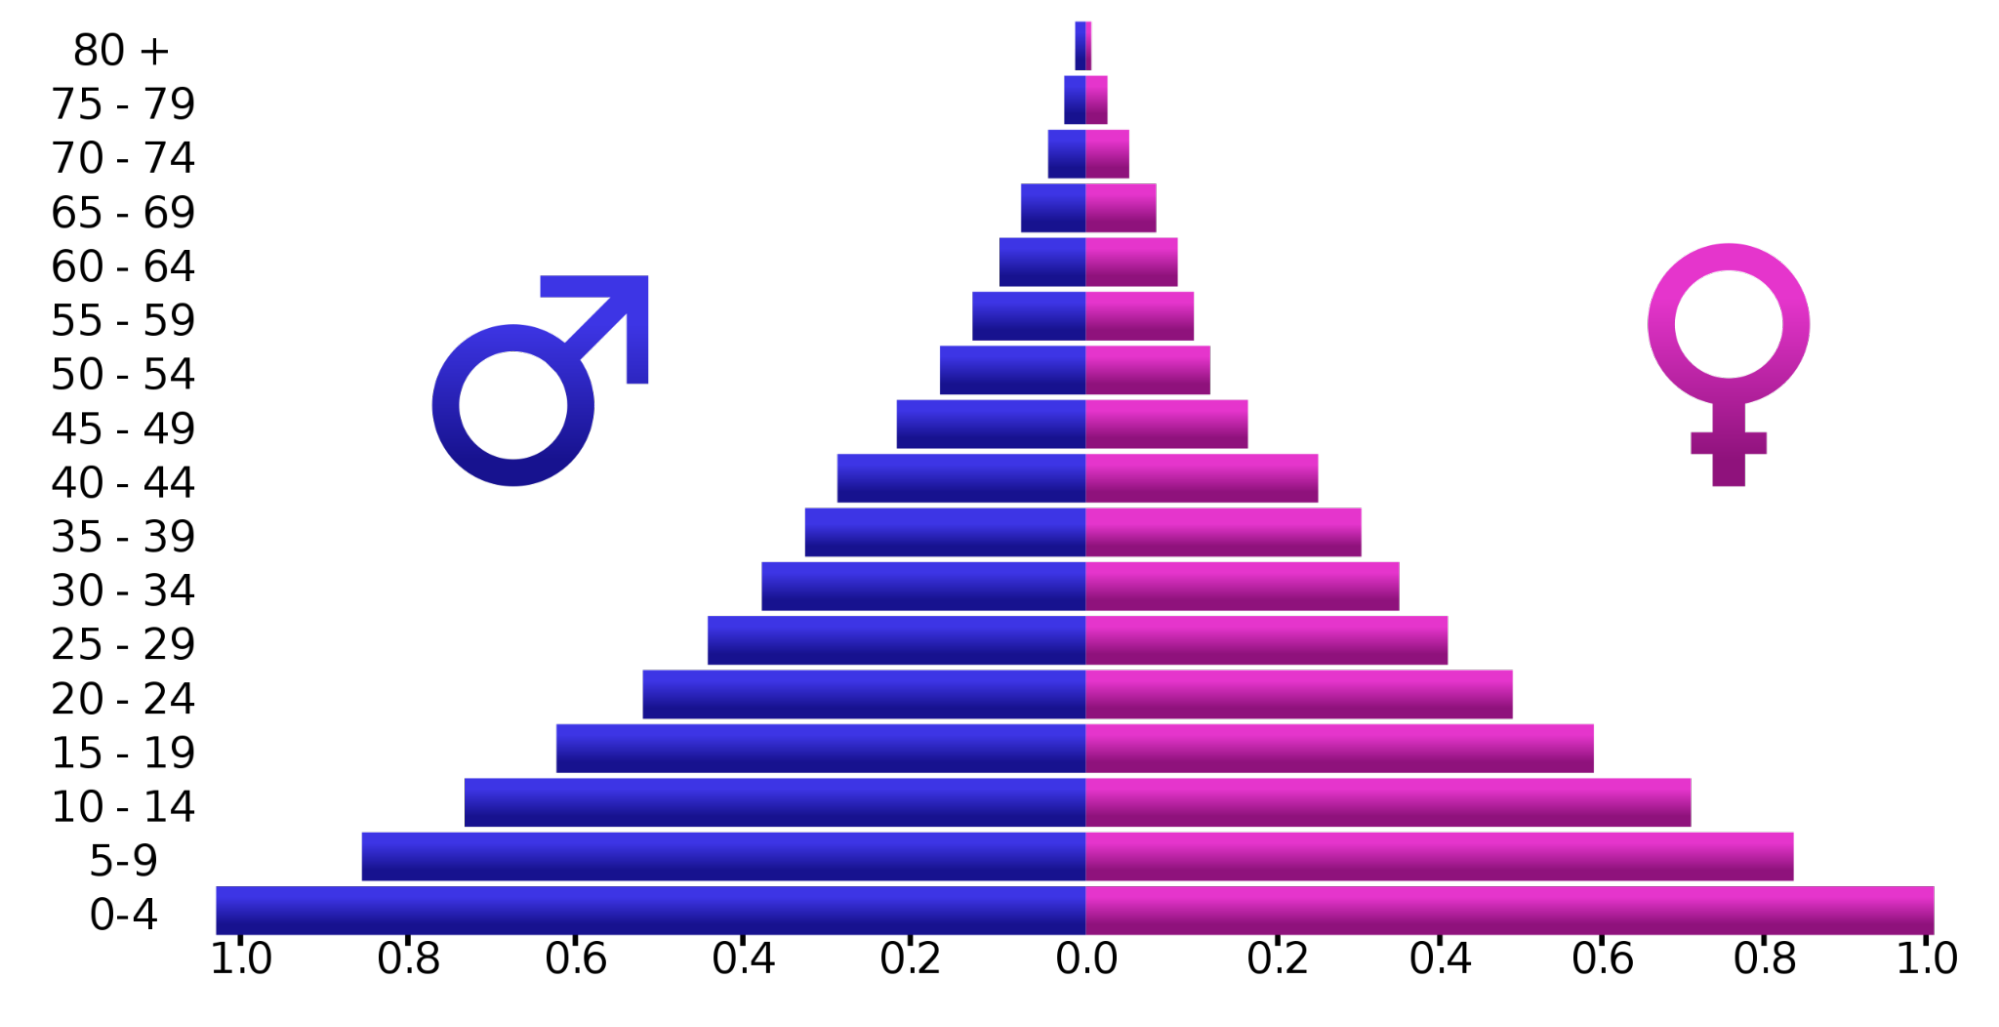
The population distribution by age and sex for Angola in 2005.
The age distribution is possibly the most essential characteristic of a population. Demographers, people who study populations, often represent both the age and sex distributions of a population using population pyramids. These are graphs or bar charts where the number or percentage of individuals in an age group are each represented by the length of a horizontal bar. Each bar is then partitioned according to the numbers of males and females. Most populations have a greater number of young persons at the base of the chart and taper off when approaching the older ages. The graph, as the name suggests, then follows a pyramid shape. Alternatively, older populations have a more uniform age distribution and do not follow a triangular outline.
The fertility rate is the factor most in charge of changing the age distribution of a population. In effect, it is also responsible for changing the shape of the population pyramid. Mortality rates, whether rising or declining, have a general effect on all age groups. Therefore it does little to change the proportions of the age distribution. However, a rise or decline in fertility immediately affects a single age group, changing the number of people who are newly born. The influence of a rise or decline in fertility rates is then focused towards the bottom of age distribution, and can inadvertently change the whole profile of the age distribution.
Developing countries typically have youthful age structures alluding to populations with high fertility. Meanwhile, low fertility populations of developed and industrialised countries account for their older age structures.
Sex Ratio
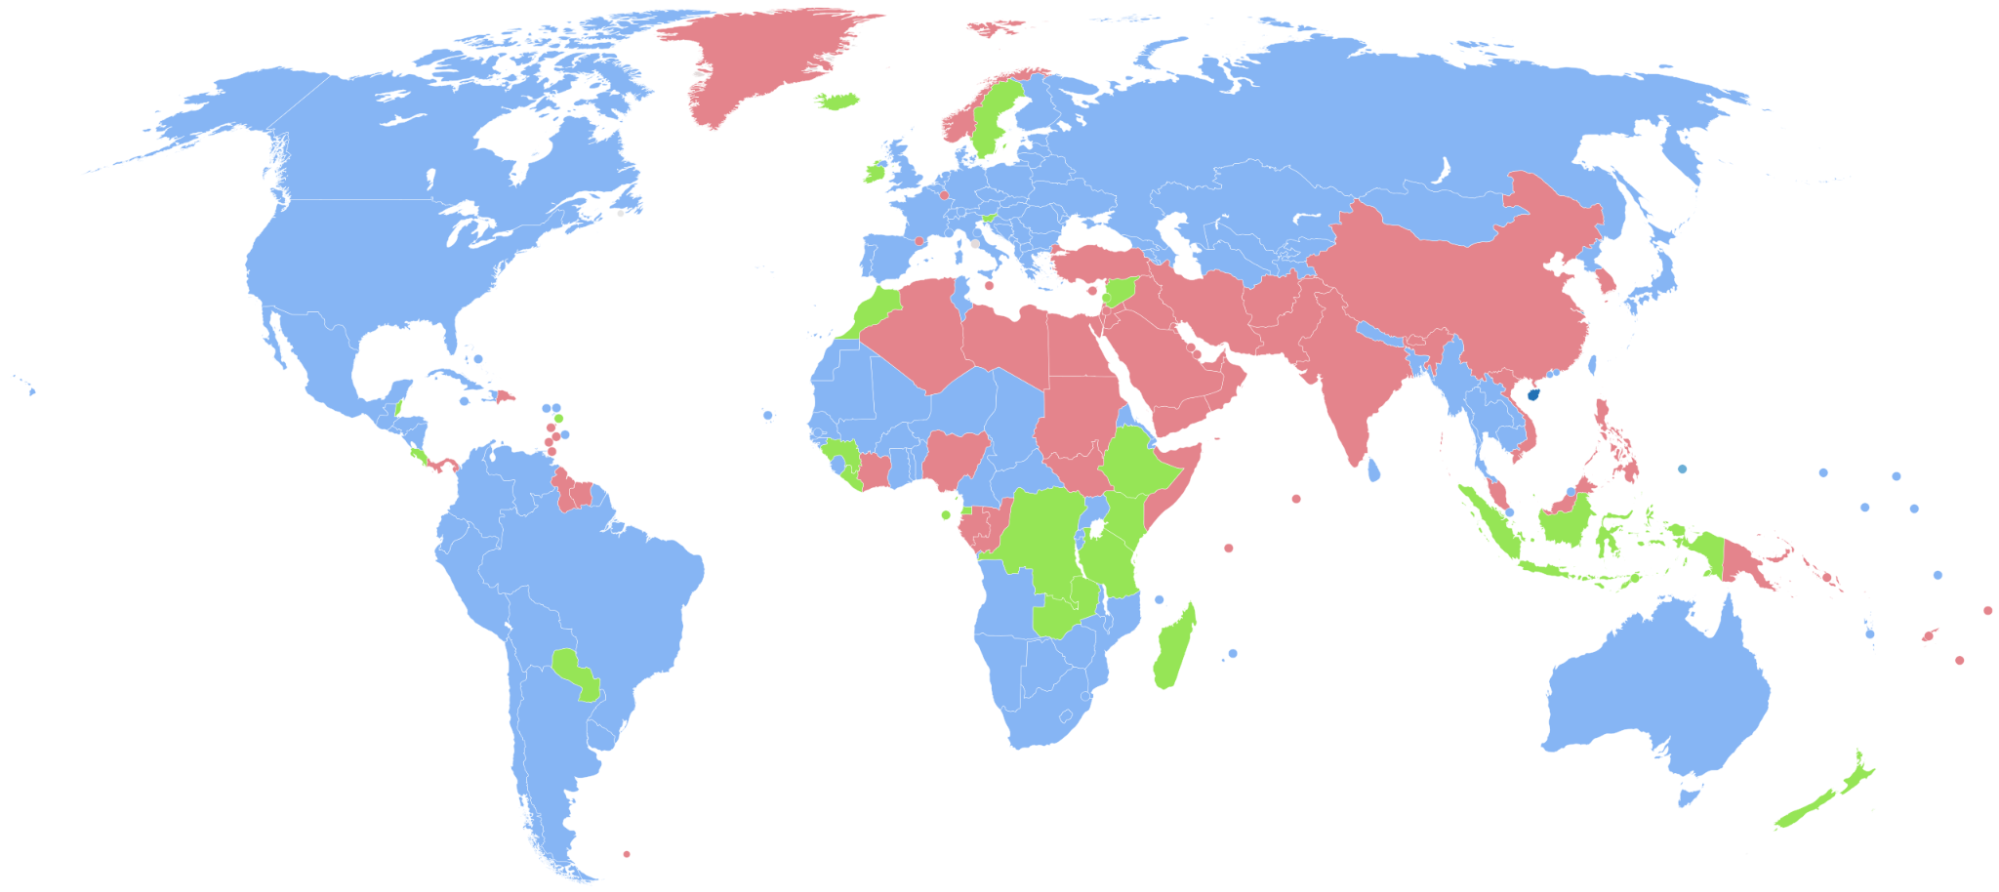
Second to age, sex is also an important characteristic of the composition of a population. Typically, there are slightly more males born than females, with a ratio of 105 or 106 males to every 100 females. Conversely, due to biological differences, males are more prone to mortality at practically any age after birth. However, for some countries the reverse is true. In India for example, females have higher mortality during childhood and the ages of childbearing. This is due to the unequal provision of resources within the family during childhood and poor maternal health care in adulthood.
Taking these generalities into consideration, with more males being born but females experiencing lower mortality rates, the number of males and females eventually becomes equal at some point. However, in later ages, females dominate the males in terms of number.
Ethnic or Racial Distribution
Ethnicity and race are two elements regarded as having great significance to society. Among the populations of the world, there exists a diversity of both race and ethnicity. Population statistics often include these two factors. Nations differ in their categories for classifying people according to ethnicity. The same person may be categorised differently depending on which country they are in. In this regard, the comparison of ethnic and racial groups internationally is often unreliable and imprecise. This element of population structure is not as objective as age and sex.
Geographical distribution and urbanisation
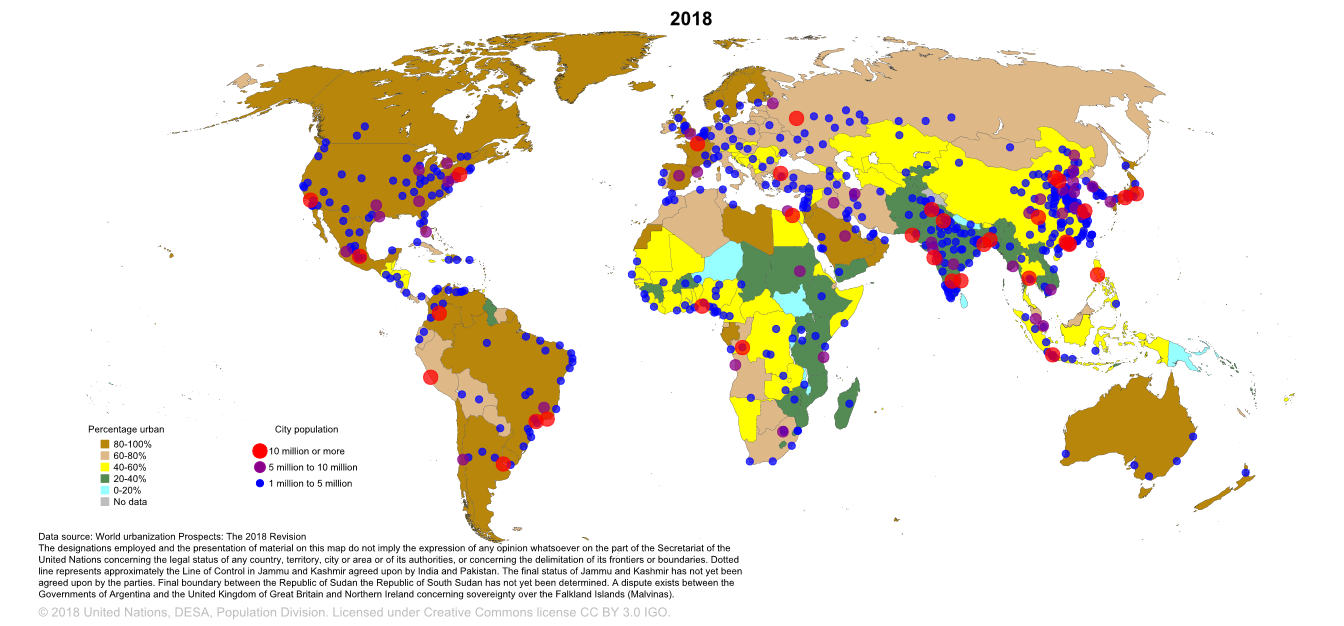
Human populations are spread out around the globe. People often use population density to talk about the population in relation to land area, but in reality, this measure is not very useful. Different areas vary in their purpose, and simply comparing population densities does not consider the unique contexts of each area. For example, a high population density may put a particularly heavy strain on agrarian societies. Meanwhile, the same population can exist in an industrialised society with little stress on resources.
The separation of urban and rural areas is also important to consider in geographical distribution. Often, populations from rural areas flock to urban areas. The concentration of people living in urban areas differs from country to country. In highly developed countries, a large portion of their population is concentrated in urban areas. In developing countries, the urbanisation process has only begun, and so the number of people living in urban areas is considerably fewer.
Frequently Asked Questions
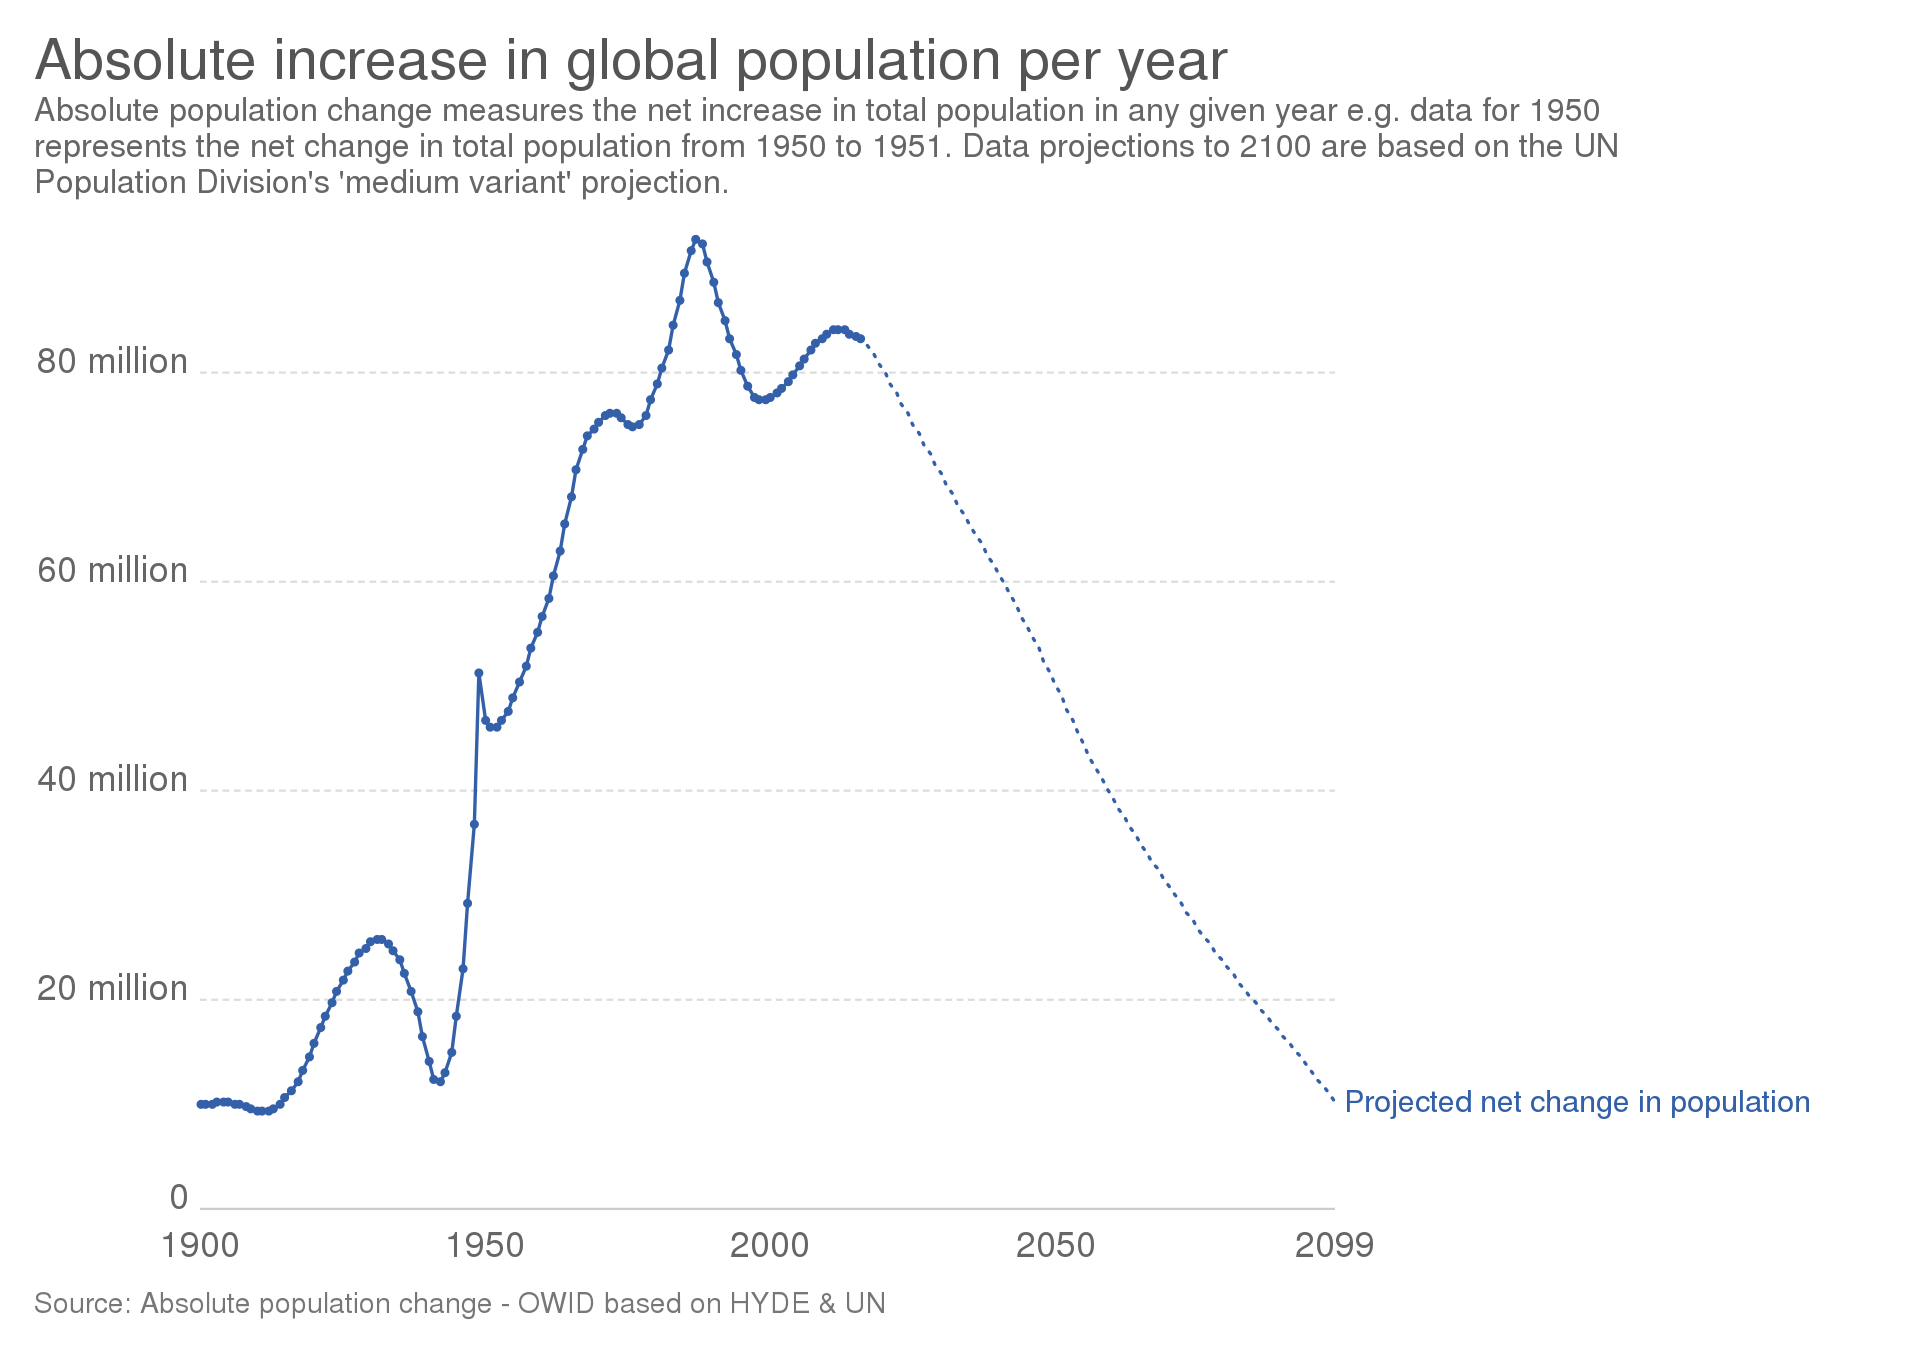
How has the world’s population changed over time?
The world’s population has grown significantly over the centuries. It reached 1 billion around 1800 and surpassed 7 billion in the early 2010s.
What factors contribute to world population growth?
Factors like birth rates, death rates, fertility rates, immigration, and advancements in healthcare and technology influence world population growth.
How does population growth impact resources and the environment?
Rapid population growth can strain resources like water, energy, and food, leading to environmental degradation, habitat loss, and increased carbon emissions.
What are the challenges and benefits of managing population growth?
Challenges include ensuring adequate resources, healthcare, and education for a growing population. Benefits can arise from a larger workforce and potential for innovation.
What are some strategies to address world population growth and its impacts?
Strategies include promoting family planning and access to reproductive health services, improving education, and encouraging sustainable resource management.
References
Population. (n.d.). Retrieved from Britannica:
https://www.britannica.com/science/population-biology-and-anthropology/
Population. (n.d.). Retrieved from Pressbooks:
https://humangeography.pressbooks.com/chapter/2-1/
Population change and structure. (n.d.). Retrieved from BiteSize: https://www.bbc.co.uk/bitesize/guides/zyxm82p/revision/1